The author is an external contributor. Views are personal and do not reflect the opinion and views of PrimeInvestor.
In the previous update, we observed that the Nifty 50 index is likely to head towards the next target zone of 26,700-27,500 range. And we also mentioned that before heading to this zone, the index is vulnerable to a short-term consolidation or correction. This scenario played out; the index has been in a consolidation phase and appears poised to head to the above-mentioned target zone.
In this update, we shall look at the short-term outlook and targets for the Nifty 50 index, sectors to focus on, and the outlook for the mid and small cap stocks.
Nifty short-term outlook
Let us get started with the daily chart of the Nifty 50 index to assess the current price action and what to expect. Pay attention to the moving averages plotted in the chart below. The green line is the 10-day exponential moving average, the red line is the 21-day exponential moving average and the grey one represents the 50-day simple moving average.
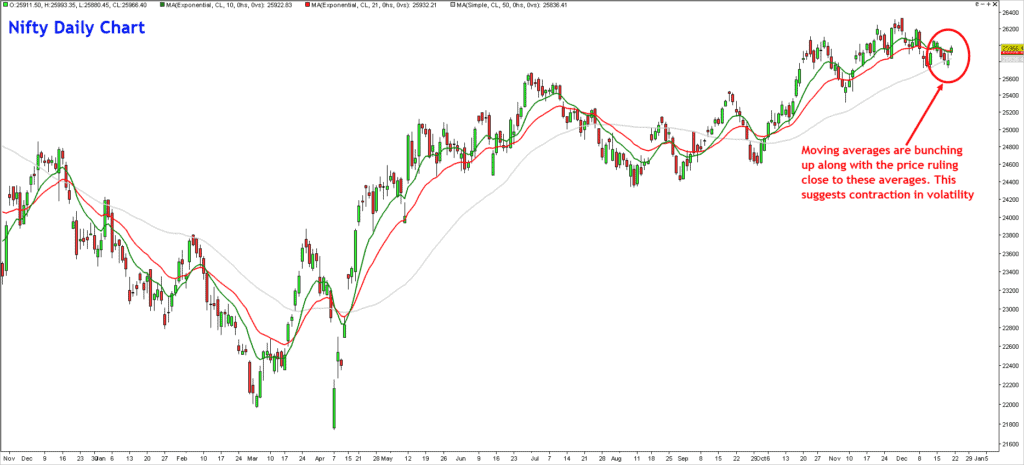
As highlighted in the above chart, the three moving averages are bunching in a tight range along with the price trading close to these averages. This is a classic sign of volatility contraction which is a precursor to a big range expansion or a directional move. Looking at the overall price action, it is not illogical to expect a breakout to the upside. Until the major swing low at 24,300 is not breached, expect the index to head towards the target zone of 26,700-27,500.
Let us also look at the breadth indicators for corroborative evidence. As always, we will use the PF-X% breadth indicator which tracks the percentage of stocks that are in a bullish swing in 1% box size in Point & Figure Chart.
The PF-X% breadth indicator for the Nifty 50 universe has been on an upward trajectory in the past few weeks and is currently at 54%. It is important for this indicator to keep pace with the trajectory of the Nifty 50 index. For now, there is no indication from the breadth indicator to contradict the bullish outlook.
The continued cause of concern, however, is the lack of participation and relative weakness exhibited by the broader markets. For example, the percentage of stocks trading above their 21-day simple moving average, from the Nifty MidSmall Cap 400 index, is yet to display any concrete signs of improvement.
This breadth indicator is currently at 40% whereas the MidSmallCap 400 index is just 5.5% away from its all-time high. What is even more incriminating is the percentage of stocks that have corrected by more than 30% from the MidSmallCap 400 index. As many as 53% of the stocks from this universe have corrected by 30% or more, an indicator of the kind of damage happening in the broader markets.
So now, we’ll take a closer look at the Nifty MidSmall Cap 400 index to understand the current technical structure and relative performance of this index versus the Nifty 50 index.
Nifty MidSmall Cap 400 Index
We have consistently highlighted in the prior updates about the need to be cautious in this segment. This index is still struggling to keep pace with the Nifty 50 index and remains a relative underperformer. Have a look at the chart featured below which captures the relative performance and the price action of the Nifty MidSmall Cap 400 index.
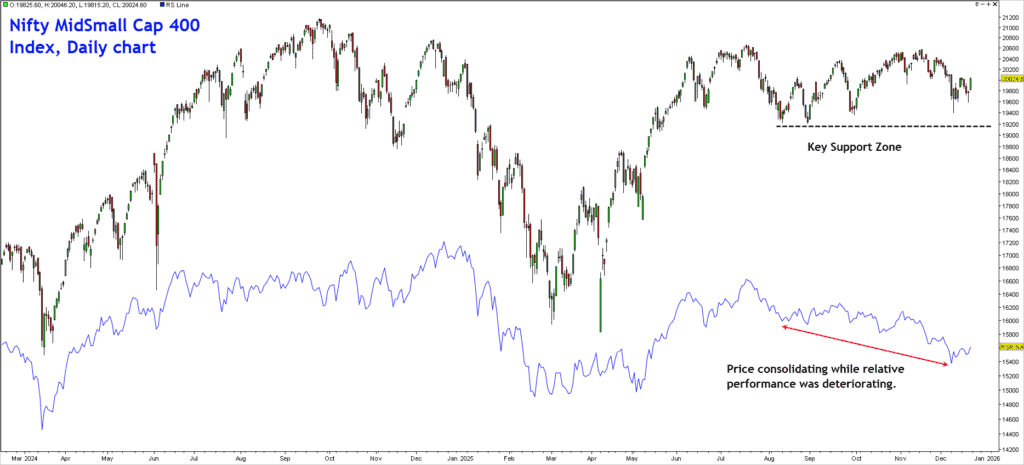
As highlighted in the chart above, the Nifty MidSmall Cap 400 index is consolidating in the recent weeks, around the key support zone at 19,000-19,200. A close below 19,000 would be a cause of concern and could trigger a much severe damage to the mid and small-cap universe.
Wait for this index to breakout above the resistance at 20,800 before committing investment in the broader market. There are select stocks that are powering ahead but the participation or the breadth is still unsupportive.
Along with the breakout above 20,800, also check the relative performance of this index in relation to the Nifty 50 index. A clear signal of outperformance is required along with the improvement in breadth. Essentially, it is a trifecta of breakout in price and confirmation from the relative performance and improvement in breadth. Until these three factors line up, there is no merit in risking capital in this segment.
Nifty Midcap 50 Index
It is a tale of contrasts as far as the Nifty midSmallCap 400 index and the Nifty MidCap 50 index are concerned. The Midcap 50 index is just 1.3% away from its all-time highs and it comes across as a relative outperformer versus the Nifty 50 index.
Here are the top constituents of this index in terms of weightage.
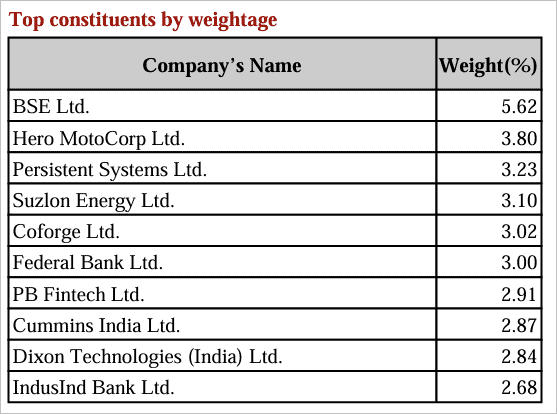
The short-term outlook for the Nifty MidCap 50 index remains bullish and the index could head to the next target of 18,300-18,800 range. The positive outlook would be under threat if the price drops below the support zone at 16,400-16,700.
Nifty Bank Index
The bank index remains a relative outperformer and the overall trend is bullish for this sector. As observed in the prior updates, the Nifty Bank index appears to be headed towards the next target zone at 62,500-63,000. The bullish outlook would be under threat if the index slides below the support level at 56,500.
In summary, the medium to long term outlook for the Nifty 50 index is bullish. We shall come up shortly with a detailed outlook for 2026. Select sectors such as Nifty Auto, Nifty Bank, Nifty Mobility and Nifty Waves are bullish and come across as relatively strong sectors versus Nifty 50.