The author is an external contributor. Views are personal and do not reflect the opinion and views of PrimeInvestor.
We had observed in the previous update that the Nifty 50 index is setting up well and appears on course to hit a new lifetime high. The recent price action has strengthened the case for such an occurrence. Let us dig deeper into the charts to assess the current technical structure and potential short-term targets.

As always, we shall get started with the daily chart of the Nifty 50 index along with the breadth indicators to assess what is in store in the near-term. We will also dive deeper into the sectors displaying relative strength and weakness. And more importantly, we shall study the relative performance of the broader markets to check if it is indeed time to invest in mid and small cap stocks.
Nifty Short-Term Outlook
As highlighted in the chart featured below the Nifty 50 index has managed to breakout above the key resistance zone that we have alluded to in our recent updates. The short-term moving averages are sloping upwards, suggesting an improvement in the trend and momentum.
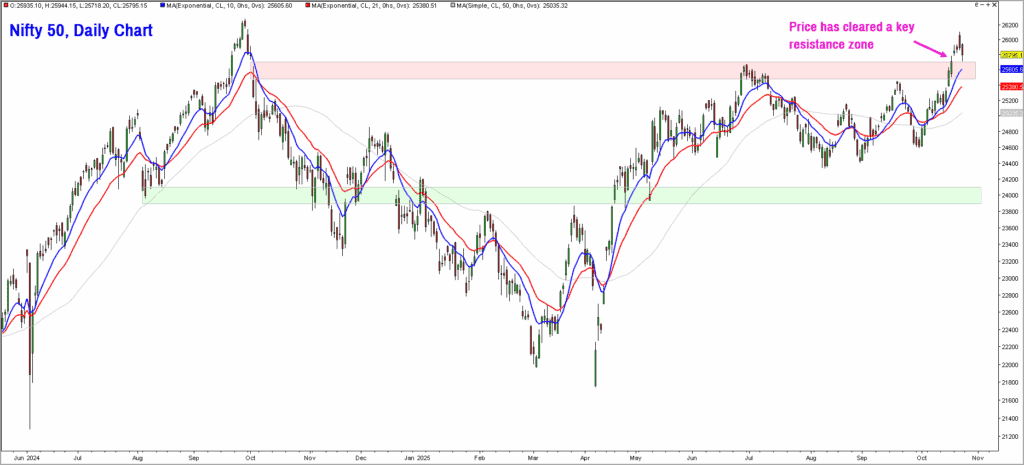
It is now important if the Nifty 50 index does pull back into the prior consolidation zone. If it does, it would be an early warning of a false range breakout. And a fall below the key support zone at 24,200-24,300 would warrant a reassessment of the bullish stance.
Based on the vertical count method in Point & Figure charts, the short-term targets for the Nifty works out to the 26,700-27,500 zone. The chances of a rally to this zone would be invalidated if the index drops below the lower end of the support zone at 24,200.
Let us also look at the breadth indicators to assess the quality of the recent recovery in the Nifty 50 index. As always, we will use the PF-X% breadth indicator which tracks the percentage of stocks that are in a bullish swing in 1% box size in Point & Figure Chart.
The PF-X% breadth indicator for the Nifty 50 universe had reached an overbought level of 86% on October 23 and has since cooled off a bit to current level of 80%. The breadth and price action point to overbought condition, hinting at the possibility of a cool off in the short-term. But as long as the price sustains above 24,200, there will be a strong case for a push towards the target zone mentioned above.
The percentage of stocks trading above their 21-day exponential moving average, from the Nifty MidSmall Cap 400 index, has also improved to 55.86% on Friday suggesting that the broader markets are attracting buying interest along with the recovery in the Nifty 50 index.
But the relative performance of the broader markets is conveying a different picture. Let us dig deeper.
Nifty MidSmall Cap 400 Index
This index has coasted higher along with the recent recovery in the Nifty 50 index. But there are no signs of relative outperformance yet. Have a look at the daily chart of the MidSmall cap 400 index featured below. The thin blue line captures the relative performance of this index versus the Nifty 50 index.
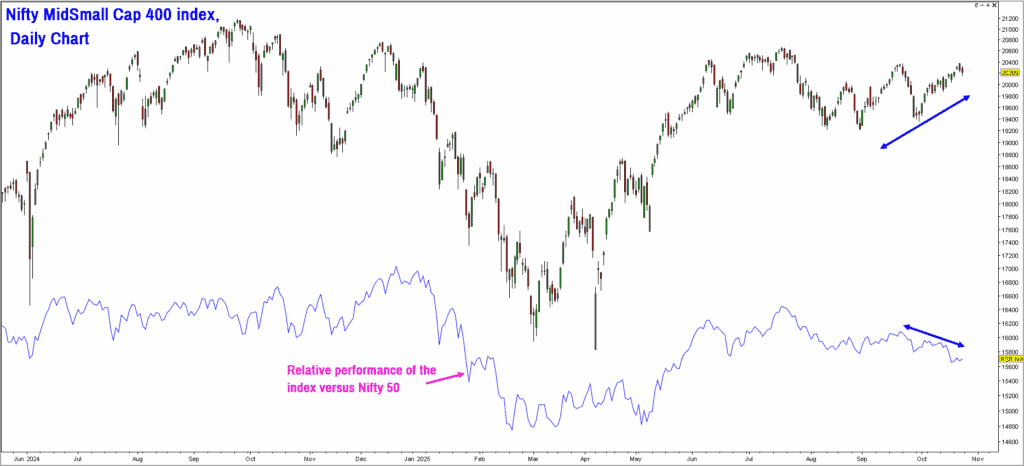
As highlighted in the above chart, the MidSmallCap Index has managed to head higher but the relative performance versus the Nifty 50 index has not kept pace and is sloping down in the past few weeks. This suggests relative underperformance of the MidSmall Cap 400 index. While the short-term breadth indicator suggests buying interest creeping into the broader markets, the performance of the index is still sub-par compared to Nifty 50.
Price wise, the trend in this index is bullish and a breakout above 20,700 could impart momentum to the uptrend. Above 20,700, the index could head towards the short-term target of 22,400-23,000. Keep an eye on the above breakout level and also track the relative performance of this index. Await signs of outperformance before stepping up fresh exposures in the broader markets.
Sector performers
Now let’s move on to other segments of the market.
Nifty PSU Bank Index: As highlighted in the previous update, the PSU Bank index has emerged as a strong performer and continues to remain bullish. The price action and relative performance is impressive for the PSU Bank index. Technically, a rally to 8,150-8,250 appears likely. The positive outlook would be under threat if the PSU Bank index drops below the support level at 6,850. Use any weakness to take exposure in fundamentally sound PSU Banks. Else, take exposure through sector funds or ETF could be a viable option too.
Nifty Auto Index: The auto index, too, has displayed bullishness both in terms of price action and relative performance in comparison to the Nifty 50 index. The short-term outlook remains positive for this index and a rally to 28,600-29,200 appears likely. The positive outlook would be under threat if the index drops below the support zone at 24,900.
Nifty Equal Weight Index: The equal weighted variant of the Nifty 50 index has displayed impressive outperformance since the covid-lows in March 2020. But more recently, the relative performance of this index has been on par with the Nifty 50 index. However, the trend in this index is bullish and a rally to 36,500-37,500 appears likely. A fall below the support at 30,500 would be a cause of concern for the Equal weighted index. Those doing lump sump and / or systematic investment in Nifty 50 index may consider including this equal weighted variant too.
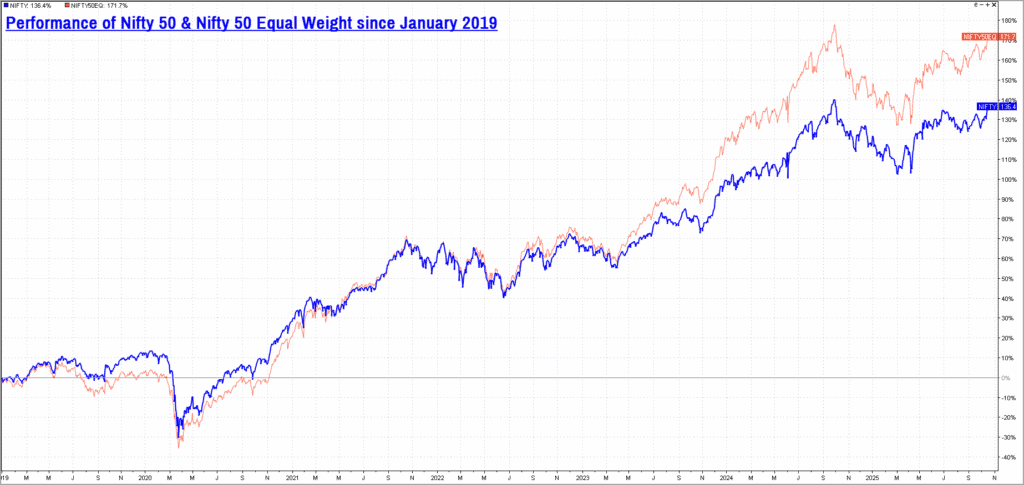
The chart above capturing the performance of these two indices gives a better idea of these two indices. Though this index has a strong correlation with the Nifty 50 index, it has managed to deliver better returns on most occasions.
Summary
The breakout above the prior consolidation zone along with the recovery in the short-term breadth indicator is a bullish sign, strengthening the case for new all-time highs to be hit soon. Along with the Auto and PSU Bank index, the Metals and Nifty MidSmall Financial Services sectors too appear bullish in terms of price action and relative performance. It would be advisable to wait a while before taking exposures in the broader markets, though.