With the Mutual Fund Portfolio Review tool, we created a unique and powerful way for you to review your entire mutual fund portfolio. At a glance, this tool showed you your live mutual fund portfolio, told you how well it was allocated, and what needed change.
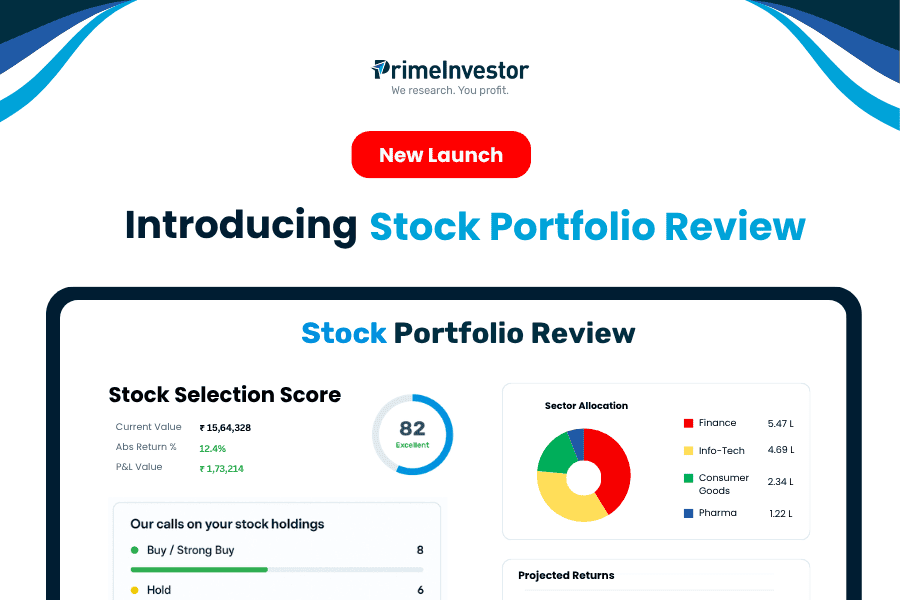
Now, it’s the time for stocks – and yet another powerful addition to our suite of offerings! We’re thrilled to launch the Stock Portfolio Review tool, a tool with which you can review and manage your stock portfolio with the same ease as your mutual fund portfolio.
Here’s explaining what the Stock Portfolio Review will do for you, how to use it, and even enhancements that we’re already working on!
Introducing Stock Portfolio Review tool
If you’ve been investing in stocks through multiple brokers or platforms, you’ve probably struggled to get a single, clear picture of your full stock portfolio. You’d have questions such as:
- How much is my overall investment and what is the total gain?
- Where is my portfolio over-exposed, in sectors or market caps?
- Which stocks should I continue to invest in, and which should be sold?
- What’s my portfolio level PE ?
With the Stock Portfolio Review tool , you’ll finally have a simple, research-backed way to answer these questions — all in one place.
What can you do with Stock Portfolio Review?
The Stock Portfolio Review is a powerful tool that gives you an overall picture of how your stock (and ETF) portfolio is structured along with calls on your stocks and an idea of how your portfolio can grow.
Here’s what the tool will do for you:
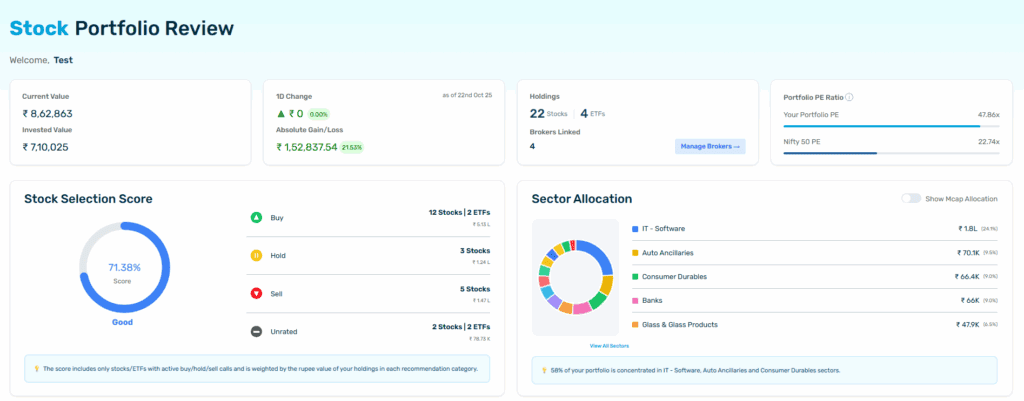
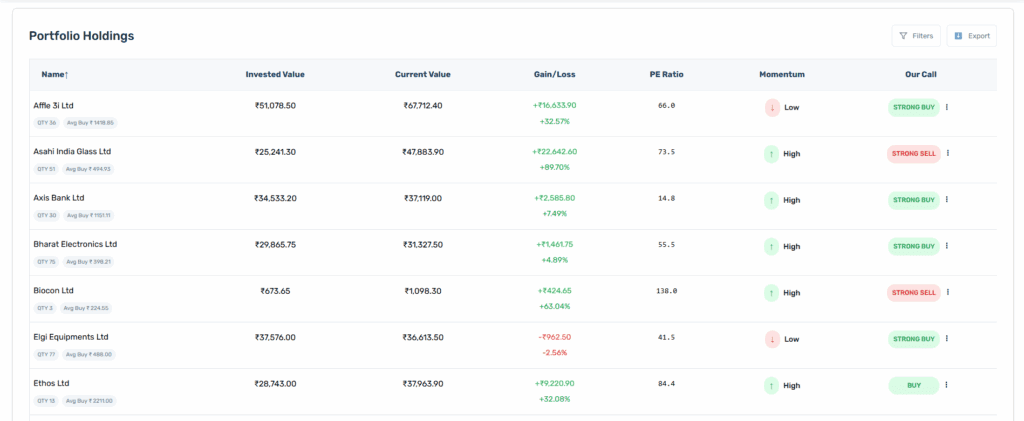
- A consolidated view of your stock & ETF portfolio: You can import your holdings directly from multiple brokerages, allowing you to see your entire stock portfolio in a single dashboard. Values are updated every day, so you will always know at a single glance how much your stock portfolio is worth. You will need to refresh your data only if you have made changes in your portfolio. You can add your family members’ portfolios, here, too!
- A snapshot of the main characteristics of your portfolio: Apart from seeing all your holdings together, you will also know your total invested value and gain/loss. You will also see your allocations to both sectors and market caps, helping you identify where your exposure lies.
- Your portfolio PE, calculated based on the weighted average, so you know if you’ve got a particular investment style! We also provide the Nifty 50 PE, for you to compare your own PE against.
- Buy/Hold/Sell calls on the stocks and ETFs in your portfolio, so you know which stocks to prune and where you can invest. These calls are based on a quantitative model we have built and this is explained more in the section below. You also get a Stock Selection Score!
- Portfolio growth scenarios that help you gauge how your portfolio can perform, based on its beta and your estimates of market returns. This is explained more in the section below.
How our calls are arrived at
Every Buy, Hold, or Sell call you see in this tool is the result of a purely quantitative model that combines multiple aspects of a company’s performance. Each stock is scored on three pillars:
- Growth: This measures growth rates of a company on metrics such as revenues and earnings. Each stock’s figures are compared within its own sector as well as within its own marketcap range.
- Quality: This assesses fundamental strength of a company’s balance sheet and operational efficiency. Here as well, each stock is compared within its sector and marketcap range.
- Valuations: This evaluates how expensive or cheap a stock is relative to its own historical range.
Each of these pillars combines multiple metrics, which are weighted to get the final score. The final score determines the call. The calls we give are Strong Buy/ Buy/ Hold/ Sell/ Strong Sell. You can use these calls to understand where your stock portfolio needs pruning, the stocks where you can avoid making additional investments, and very importantly, which stocks you can consider if you want to up your exposure.
It’s important to note here that these calls are made on a quantitative model. There are no forward estimates that we incorporate (since it’s not possible to do so for the several hundred stocks there are), and we do not consider any qualitative aspects such as business prospects, nature of industry, management strength, etc. The call is also on the basis of the stock’s score alone and does not take into account your own individual exposure or holding period etc.
We have balanced different metrics and timeframes, and incorporated multiple comparisons in order to make the model a comprehensive, balanced one. The ‘Research Snapshot’ next to each stock provides more details on where a particular stock has scored or failed.
Visualizing portfolio growth
To help you visualize how your portfolio might grow, we’ve added a portfolio growth calculator that incorporates the CAPM model (i.e., a model that estimates a portfolio’s returns based on beta, risk free rate, and market return).
Accordingly, this section uses the following:
- Your portfolio beta, which the tool already calculates for you based on the weighted beta of stocks you’re holding
- A standard risk-free rate that we have set, both in order to be realistic and since it may be difficult for most to arrive at.
- Your estimate of how much markets in general can return. It’s easier to set overall market return expectations than it is to define clearly what your portfolio return could be. You can enter any return figure you want but remember to be realistic in this estimation! We’ve given a default return estimate, but you’re free to experiment as you wish.
- A tolerance band to create base-case, optimistic, and conservative scenarios so you can see what the impact may be if your return estimates don’t pan out the way you thought.
The calculator then shows your potential portfolio value. You can run these projection estimates for up to 3 years.
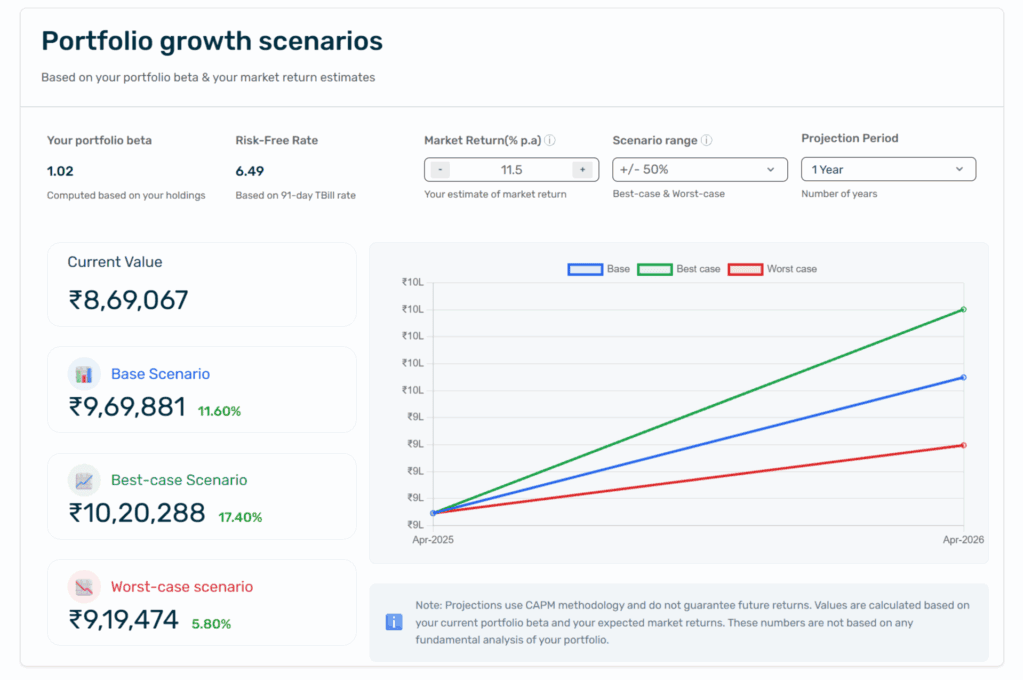
Always remember that these are just estimates, intended to help you understand how much wealth you may be able to build. Your actual portfolio value will depend on the performance of your stocks, changes you make, and so on. These are not guarantees of returns.
How to get started with Stock Portfolio Review
Using the Stock Portfolio Review tool is easy! We’ve outlined the steps below, but you can view a demo of using the entire tool here.
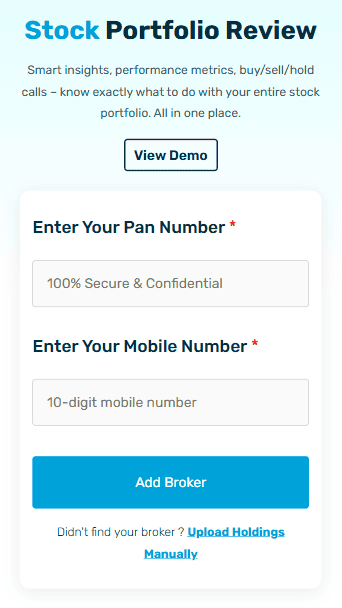
Step 1: Add your PAN and phone number to fetch holdings securely through your broker.
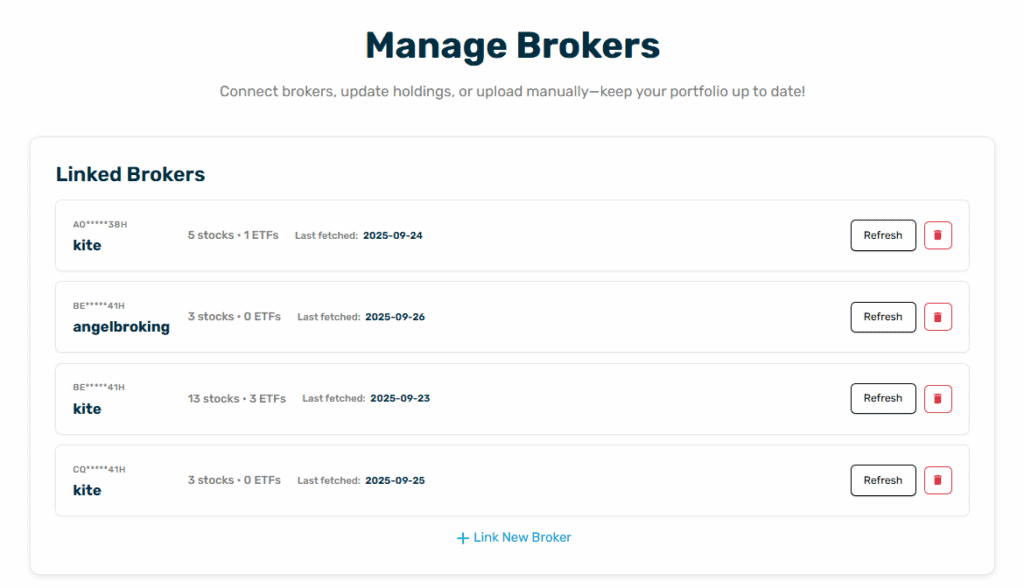
Step 2: Choose and link your broker. You can add up to five accounts currently, including family member accounts. This will import your stock and ETF holdings directly. Once imported, the prices and investment values will update automatically. But if you have made any changes in your portfolio, you will have to refresh your holdings using the ‘Manage Brokers’ section to update your portfolio in the tool.
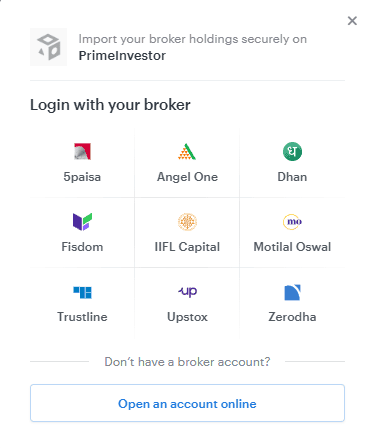
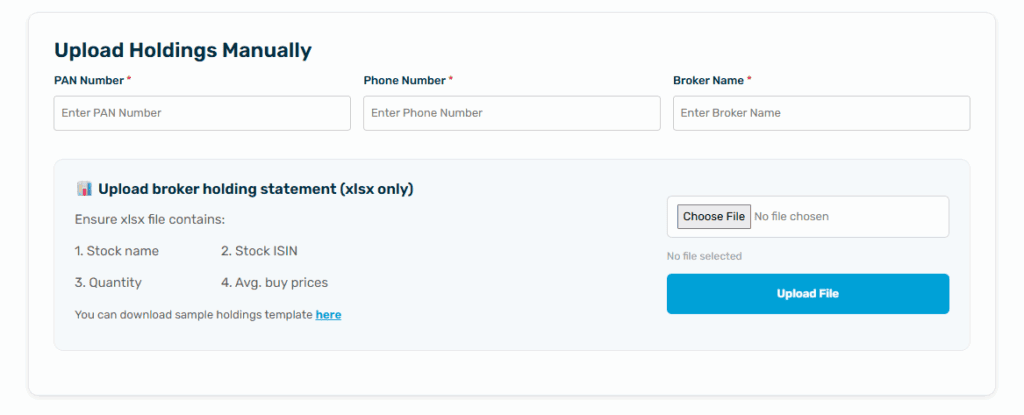
Not all brokers will be listed for direct import. Therefore, to enable importing of portfolios held under other brokers, we have provided a manual upload option to add holdings. You will need to download your holdings from your broker, in Excel format, and upload this onto the Stock Portfolio Review tool. Ensure that your Excel contains the following column heads:
- Stock name: Do not repeat stock names in multiple rows – you will need to consolidate all holdings in a single stock as a single row entry
- Stock ISIN
- Quantity held in that stock in total
- Average buy price of the stock, which incorporates all the buy transactions you may have done in that stock
Most brokerage portfolio holding reports already directly contain the information as above. You will simply need to upload that Excel.
And that’s it! Once you do the steps above, you will get the full Stock Portfolio Review analysis!
All your data is securely encrypted and stored only for analysis. We do not have access to your broker or demat account and we cannot place any transactions on your behalf.
What’s next
We’re already working on the following enhancements to make your review even more powerful:
- Combined Dashboard to view stocks & mutual funds value growth together
- Comparison of your sector allocation and stock allocation vs the Nifty 50
- Alerts when our calls on your holdings change
Stay tuned — these will roll out soon! Meanwhile, why don’t you go ahead and review your stock portfolio?


18 thoughts on “New Launch: Introducing Stock Portfolio Review tool”
Thanks for the initiative. This could be gamechanger for the subscribers. I have one suggestion- currently the basis of your recommendation is not clear. The research snapshot against a stock is not clear. For example, despite scoring high on almost all parameters- icici lombard is showing as strong sell. It will help if the basis and methodology for the suggested action is more elaborately explained
request your revert
We’ve noted your suggestion, will see what we can do to make the research explanation more understandable. – thanks, Bhavana
Are the buy or sell calls will be manually checked, and should we follow them?
The Buy/Sell/Hold calls are given based on our quantitative model that measures a company’s performance relative to its peers and marketcap bcukets, across multiple metrics. There are no qualitative aspects that are considered and we do not manually go through or alter every call. Please note that a call can change over time based on the company’s earnings, valuations etc. The ultimate decision to buy or sell is yours. – thanks, Bhavana
Hello PI Team,
Stock holdings review tool is valuable addition.
Feature request: XIRR for stock only portfolio (with an option to include or exclude realised gains/losses], This can enable users to arrive at expected returns factoring in hostorical performance for forecating the projections
Grwoth forecast is limited to 3 years should be longer(Acknowledging stocks are not MF which are held longer without churn]
Thanks
XIRR is not possible to calculate & show. One, we do not get an investor’s entire stock portfolio – only the specific brokers linked. Second, we do not get the transaction history in order to do the calculations. So we’re able show only absolute gains/losses for the portfolios uploaded. – thanks, Bhavana
Yes transaction history is a miss 🙁
Was hoping to have a simple mechanism to view the performance for stocks only, it is not easily availble even with broker to check XIRR for a subset of holdings. I am referring to Zerodha in particular.
Will redirect the feature request to broker 🙂
Note : In general these kind of summary/comparisons are valuable, building an excel, inserting/importing data is not an enjoyable process for passive investors
Obviously missing SGBs. Pls see if this can be added.
We unfortunately do not receive live price data for SGBs from our service provider. So anything we show with regard to SGBs will not be up to date or useful. – thanks, Bhavana
Excellent tool. Keen to see the upcoming enhancements. You guys add a lot of value. Kudos !!!
Thank you! – regards, Bhavana
No hdfc and icici?
No, these brokers are not linked for direct import. You can manually upload holdings for these brokers. – thanks, Bhavana
I tried uploading the holding statement of hdfcsec in xlsx but unable to – showing error
Can you please write to us at [email protected] with a sample of what you have uploaded? The statement needs to have specific information. The sample format will be given in the tool as well, if you want to check. – thanks, Bhavana
Thanks a lot for this excellent tool, used it and found really useful.
Thank you! Glad you found it useful. – regards, Bhavana
Comments are closed.