With inputs from Pavithra Jaivant
The Nifty50 has not done much in the last six months, thanks to the Iran war and persistent FII selling. However, some segments of the market have been on fire. Among them are the stocks of new-age internet companies. From April to September 2026, the Nifty India Internet Index has gained 22%, compared to the Nifty 50’s 0.3% loss during the same period. The gains were broad-based, with 15 of the 24 constituents rising by more than 20%.
The Nifty India Internet Index was introduced in February 2025 to track companies whose businesses operate through online platforms. Of the 24 companies currently listed in the Nifty India Internet Index, 16 were listed only after COVID and many of them have experienced sharp corrections since their listing. From the index base date of October 2021 till March 2026, the Internet index was up 1.6% against 5.5% of Nifty 50. These platforms have become an integral part of our day to day lives, with millions of users and significant transaction volumes across payments, commerce, travel, food delivery and other digital services, highlighting the scale of India’s internet economy.
We had written about Internet ETFs in June 2025. We had highlighted how these businesses remain vulnerable to regulatory changes and intensifying competition. In recent weeks, the Indian internet and platform ecosystem has seen several surprise regulatory developments, ranging from MDR (merchant discount rate) on UPI to the proposed commission caps in insurance. These developments have once again brought internet-platform companies into focus.
We thought this would be a good time to look at what has driven the index outperformance and what has been happening to the key constituents.
Inside the Index: Winners and Laggards
Outperformers
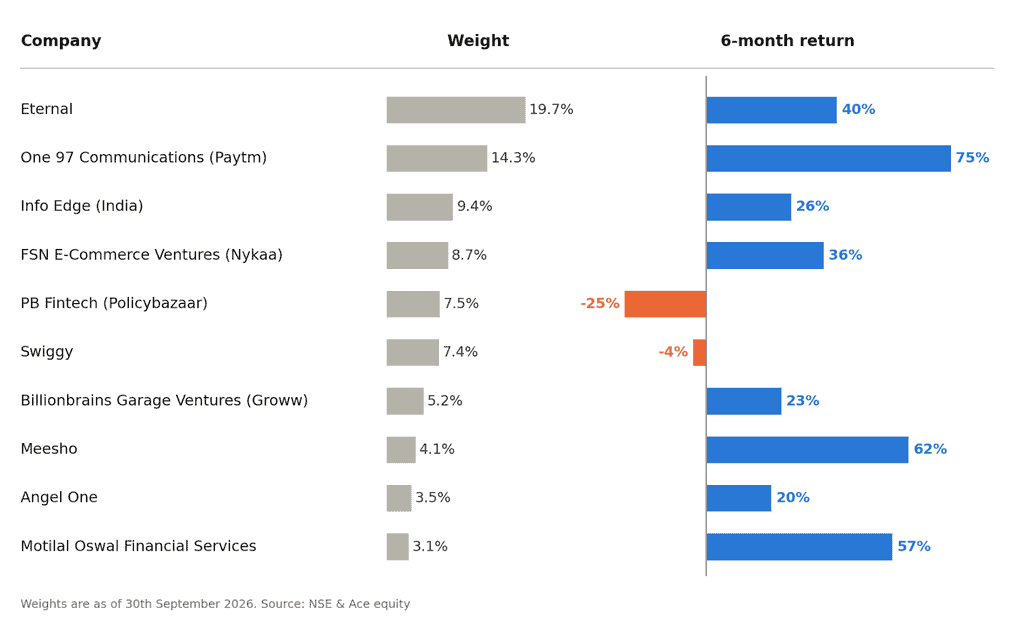
The index’s outperformance in the last 6 months has been led by Eternal (+40%), One97 Communications (Paytm, +75%), Meesho (+62%), Nykaa (+36%), among others.
Eternal has performed well on the back of improving Quick Commerce adjusted EBITDA profitability, following its break-even in Q3FY26. Paytm and Nykaa have recovered towards their listing prices after nearly five years. Paytm’s strong performance has been supported by improving metrics across its Payment Services business, including subscription merchants, merchant GMV (gross merchandise volume) and customer UPI GTV, along with growth in its Financial Services distribution business. The UPI MDR, recently introduced is an additional tailwind.
Nykaa (FSN e Commerce) has also performed well, delivering strong growth across its Beauty and Fashion segments, with profitability in the Beauty segment continuing to improve and the Fashion business reaching EBITDA breakeven in the latest quarter. The company has also announced its FY30 targets, which include 2x–3x revenue growth and 4x–5x EBITDA growth.
Info Edge (Naukri) and Motilal Oswal have also run up sharply following significant corrections, with both moving back towards their 2024 highs. Groww has also grown, supported by improving operational and financial performance.
Laggards
The notable laggards have been PB Fintech, for the reasons we’ll discuss ahead and Swiggy. Although Instamart’s margins have improved, Swiggy is yet to demonstrate that its slower, margin-focused strategy can translate into sustained improvement in NOV (net order value) growth and profit margins, particularly amid continued competitive intensity.
Recent Updates – Make or Break
#1 From Free to Fee: UPI’s Next Chapter
Behind the QR Code
To understand the recent introduction of MDR on UPI, it helps to first see what happens behind a simple UPI payment. Say you pay Rs. 800 at a store by scanning a QR code in PhonePe. Your money is in your SBI account, and the store’s account is with Kotak Mahindra Bank. Multiple parties make this payment possible:
- Payer’s bank: The bank that holds your money and debits it. Here, it is SBI.
- Beneficiary’s bank: The bank that receives the money. Here, it is the store’s Kotak account.
- UPI app provider: The app used to pay or receive money, such as PhonePe, Google Pay or Paytm.
- PSP (Payment Service Provider) bank: The sponsor bank that connects a UPI app to NPCI’s network. Apps like PhonePe are not banks and can’t plug into UPI directly. The handle after the “@” in a UPI ID identifies the PSP bank
- NPCI (National Payments Corporation of India): The umbrella organisation for retail payment systems in India, set up by the RBI and the Indian Banks’ Association. It runs the UPI network that connects everyone above.
The Cost of Running UPI
Although UPI has been free for users, processing each payment and maintaining the infrastructure costs money. In its 2022 Discussion Paper on Charges in Payment Systems, the RBI estimated that processing a ₹800 person-to-merchant (P2M) UPI transaction costs about Rs. 2, or 0.25% of the transaction value. Extended across all P2M transactions, this adds up to roughly Rs. 20,000 – 22,000 crore a year to maintain the UPI infrastructure. This cost is shared by the payer’s bank, the beneficiary’s bank, the UPI apps, the PSP banks and NPCI.
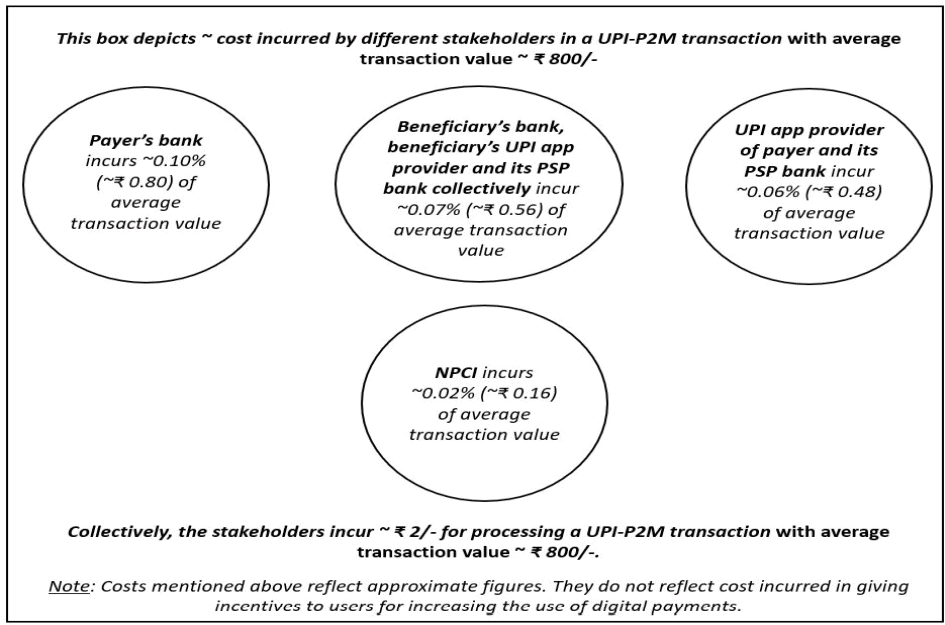
Source: RBI paper ‘Discussion Paper on Charges in Payment Systems’
UPI MDR: What Changes and Who Pays??
On 15 September 2026, NPCI announced a Merchant Discount Rate (MDR) on select UPI payments, effective 15 October 2026. Reports suggest this effective date may now be deferred to January 2027. MDR is a fee that the merchant, not the customer, pays for accepting a digital payment. UPI has had no such fee on merchant payments since January 2020.
Where UPI MDR Applies?
- Person-to-Merchant (P2M) payments above Rs.2,000: 0.4% MDR. This fee is capped at Rs.300 per transaction for payments of ₹75,000 and above.
- P2M payments up to Rs.2,000 remain free.
- Small merchants receiving up to ₹1 lakh a month through UPI QR codes are exempt.
- Essential services such as railways, telecom, insurance and fuel: A flat Rs.5 per transaction (on payments above Rs.2,000) instead of a percentage.
- Person-to-Person (P2P) payments made to friends, family or self-transfers are free.
In our view, UPI remains an attractive payment option for merchants, given the relatively higher cost of card payments. Debit card MDR can range from around 0.3% to 0.9% of the transaction value, depending on the merchant category and payment infrastructure, while credit card MDR is typically in the range of 1.5% to 3%. Unlike the proposed UPI MDR, debit and credit card MDR do not have a minimum transaction threshold.
However, the entire UPI transaction base will not be chargeable, as P2P transactions and merchant payments below Rs.2,000 remain exempt. P2M payments accounted for roughly 29.6% of total UPI transaction value, amounting to Rs.1,01,466 billion out of Rs.3,43,196 billion, during the 12 months from October 2025 to September 2026. Of the P2M transaction value, around 68% was from transactions above Rs.2,000.
The introduction of MDR would enable payment ecosystem players including issuing banks, beneficiary banks, payment apps and payment aggregators to access a new revenue pool for the first time since UPI’s introduction. According to brokerage estimates, the 0.4% MDR could be distributed roughly as follows: 40% to the payer’s bank (16 bps), 30% to the beneficiary bank (12 bps), 20% to the payer’s payment app (8 bps), and 10% to the payer PSP bank (4 bps).
This is a meaningful positive for One97 Communications (Paytm), which processed Rs.20.80 trillion of UPI consumer transaction value in the 12 months ended June 2026 and accounts for around 7% of UPI transaction value.
#2 Insurance Commissions Face a Reset
If MDR is a positive development for payments systems providers, the next development is a potential threat for insurance distributors. On September 23, 2026, IRDAI published a consultation paper titled ‘Recalibrating Economics of Insurance Distribution’. It proposes far-reaching changes to how insurance products are marketed and distributed. We had written an article about what this means for policyholders. Here’s what it means for PB Fintech, whose stock has lost nearly half its market capitalisation since the paper came out.
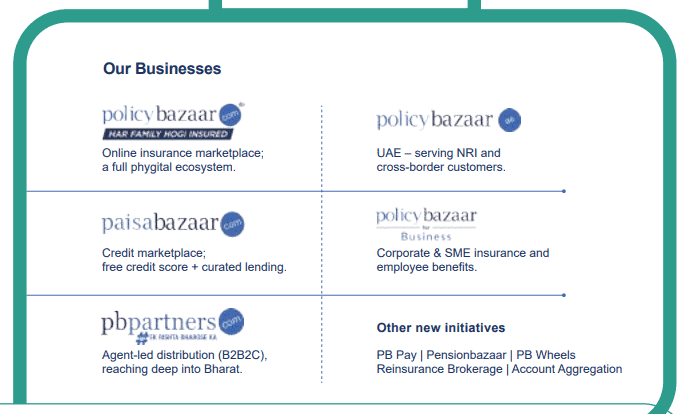
About PB Fintech
- It is a technology company that runs digital marketplaces for insurance and lending products, under the Policybazaar and Paisabazaar brands.
- It helps customers research, compare and buy financial products.
- It does not underwrite insurance or hold credit risk on its books.
- It earns commissions from its insurance and lending partners.
The proposed rule changes
- Strict commission ceilings will be imposed on insurance selling
- Commissions would vary by product type. Products that largely sell themselves, such as motor, would earn less. Complex products that need more nuanced sales and distribution effort would earn more.
- Market aggregators (MIIs) would earn lower commissions.
The rationale is that commissions have grown much faster than premiums in recent years. The paper is not final, and stakeholder feedback is due by October 25, 2026.
Why health and motor insurance matter
Retail health is one of PB Fintech’s main earnings segments, and the company holds about 30% of the market there. In 2023-24, IRDAI removed product-level commission caps and insurers could set their own board-approved commission structures, as long as they stayed within an overall Expenses of Management cap. Commission payouts on new individual health policies average 24% but could go up to 70% depending on the insurer currently.
The recent consultation paper proposes bringing back product-level caps, depending on the distribution channel. In individual health policies, commissions would be capped at 15% or 20%.
On Motor, commissions for the industry averaged 26%. They will now be capped at 0% to 15% depending on the entity selling the cover and the type of cover (whether third party or own damage). Therefore, PB Fintech’s other key general insurance segment, will not earn any commission if the paper is accepted.
The paper’s proposed caps for health and motor are mentioned in this article.
The paper also aims to curb “dark practices”. This raises questions about whether PB Fintech’s call-centre-led sales approach can continue in its current form.
Impact and management response
Chairman and Group CEO for PB Fintech, Yashish Dahiya has said general insurance commission rates would fall to roughly 40% of today’s levels. Estimates point to a potential 30% hit to PB Fintech’s core online insurance revenue by FY28.
Management has said it could respond with cost rationalisation, volume ramp-ups, or more radical pivots, such as going commission-free or moving into insurance manufacturing. These ideas are still at an early stage, and they did not calm investors. PB Fintech had only recently turned EBITDA positive after more than 15 years of losses. The stock has fallen from Rs 1,886 to Rs 985, and the proposals have put its revenue model under serious strain. The next milestone is the 25th October deadline for stakeholder feedback on the consultation paper.
#3 Quick commerce enters the next lap
India’s quick commerce race is intensifying. Blinkit has now posted positive Adjusted EBITDA for three consecutive quarters, and Swiggy Instamart came close to contribution breakeven in the June 2026 quarter. Challengers are scaling just as fast: Amazon Now has crossed $1 billion in annualised gross sales, Flipkart Minutes has expanded to over 1,000 dark stores across 120-130 cities, and Zepto is on track to approach $1 billion in annualised net order value.
Blinkit and Instamart have steadily improved over the last six quarters. However, the recent expansion of Amazon Now and Flipkart Minutes could threaten Net Order Value (NOV) growth and profitability for the listed players.
The earlier concern has been largely resolved. Investors used to worry about two things: whether dark store unit economics would work, and whether individual stores could reach the scale (orders per day) needed to turn profitable. The listed players have now largely proven both in large cities.
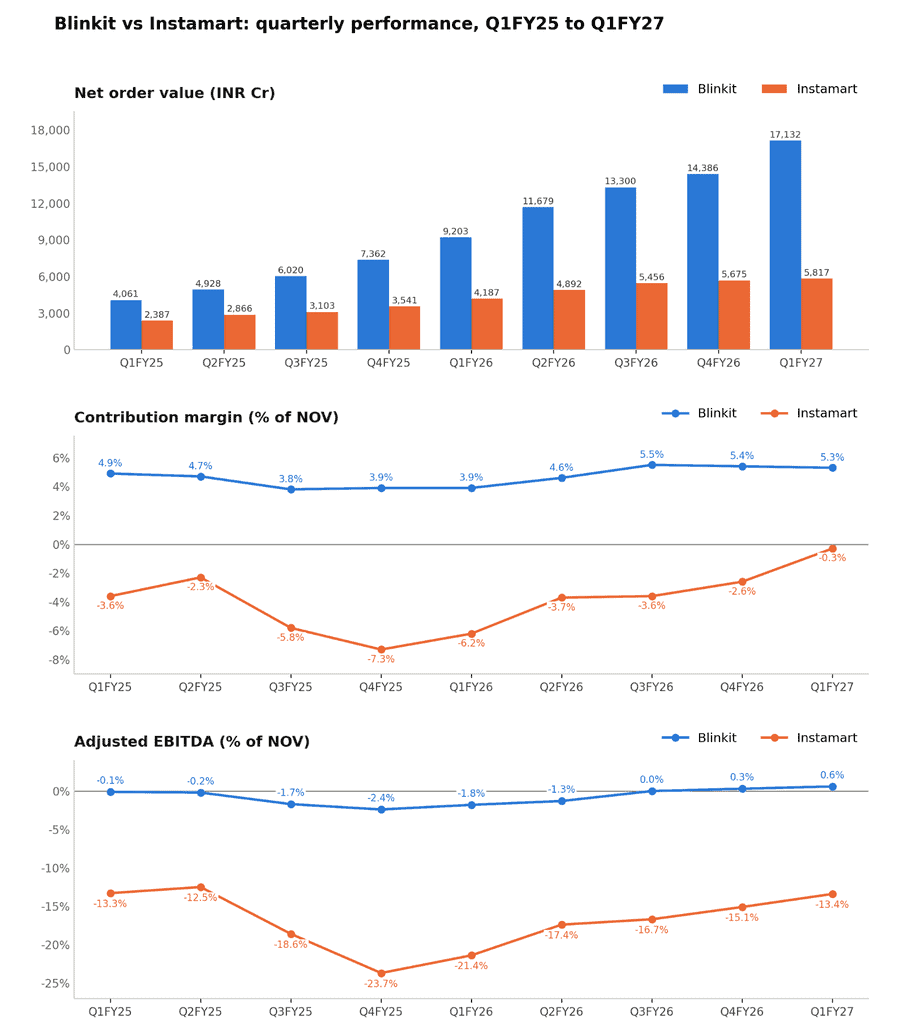
Blinkit reported in the Mar-26 quarter that its larger, more mature cities (including Delhi NCR) have reached a steady-state Adjusted EBITDA margin of 5-6%, which is also its medium-term target for quick commerce. At the aggregate level, store throughput (NOV per day per store) has kept rising even as it continues to add dark stores. Its shift to an inventory-led model a year ago has also helped in its margin improvement trajectory.
Instamart took a different route in Q4FY25. It slowed store additions, weeded out low-AOV, low-frequency, discount-seeking users, and chose not to match competitors at the bottom of the AOV (average order value) pyramid. As a result, its contribution margin improved from -5.8% in Q3FY25 to -0.3% in Q1FY27. Like Blinkit, Instamart is also moving to an inventory-led model, to improve its margin trajectory. Instamart has not yet matched Blinkit’s results, but its latest quarter showed progress:
- 45%+ of stores are CM positive
- 25% of the network operates at a 3-5% CM
- 5 of its top 7 cities are CM positive
What to watch next. The model is now starting to work for the top players in metro cities, where population density supports high store throughput. However, the recent expansion of Amazon Now and Flipkart Minutes could threaten NOV (net order value) growth and profitability for the listed players. Two questions remain open:
- Tier 2 and above expansion: As players are moving into smaller cities, population density declines. It is unclear whether dark stores there can generate enough daily orders to hold up the economics.
- Competition in top cities: The top 10 cities already have more than 3,500 dark stores (excluding Amazon and JioMart). Can the incumbents keep growing NOV at high rates while protecting their margins?
The listed players do have deep pockets to absorb the pressure. As of June 2026, Eternal held cash of Rs.18,288 crore and Swiggy held Rs.14,367 crore.
How to play the sector
Internet companies can be complex to analyse. While these companies often cater to large Total Addressable Markets (TAMs) implying a significant runway for growth, competition is picking up and many are still not profitable. As a result, investors cannot rely solely on earnings to value them and instead need to track a wide range of operating metrics each quarter. The metrics used vary across companies, and brokerages often rely on different parameters and valuation frameworks to assess them. These include NOV, contribution margin, store throughput, take rates, user engagement, etc. and each company reports these metrics differently.
Competition can also shift rapidly, as seen in quick commerce, while regulatory changes can alter a business’s economics almost overnight. Investors therefore need to stay on top of operating metrics, competitive dynamics and regulatory developments to hold these stocks with confidence.

Let experts manage your wealth
At PrimeInvestor, our Portfolio Management Services are built on one principle: protect on the downside, compound on the upside. Whether you’re starting your wealth journey or looking to bring discipline to an existing portfolio — we have a strategy for you.
Explore our PMS →The top five constituents account for about 60% of the index. Eternal, Paytm and Nykaa (together about 43%) currently have positive tailwinds, while PB Fintech (about 7.5%) faces ongoing headwinds. Info Edge (Naukri) is neutral for now: it is reporting good numbers, but it also holds a 6.5% stake in PB Fintech, so it carries some exposure to that weakness. Investors need to keep this in mind if they want to take exposure in the index.
For those who prefer not to follow each company closely, ETFs tracking the Nifty India Internet Index offer a good way to gain diversified exposure to the theme. However, liquidity in these ETFs remains low due to their relatively small AUM. Another way to participate in the theme is through our PMS strategies, where we have generated good returns from one of the index constituents. If you would like to know more about our PMS strategies, schedule a call with us.