The author is an external contributor. Views are personal and do not reflect the opinion and views of PrimeInvestor.
In the previous update on the outlook for the Nifty 50 index, we had made a case for short-term pull back rally in the Nifty 50 index. The anticipated rally did happen and the index reached the target zone of 24,000-24,500 mentioned in the update. In this report, we will re-assess the short-term outlook for the Nifty 50 index as well as a few sectoral indices.
Nifty short-term outlook
Here is the daily chart of the Nifty 50 index. As highlighted in the chart below, the index is tracing out a bullish sequence of higher highs and higher lows from the lows recorded in late November. The price has also managed to move above the 50-day moving average, which is another positive sign.
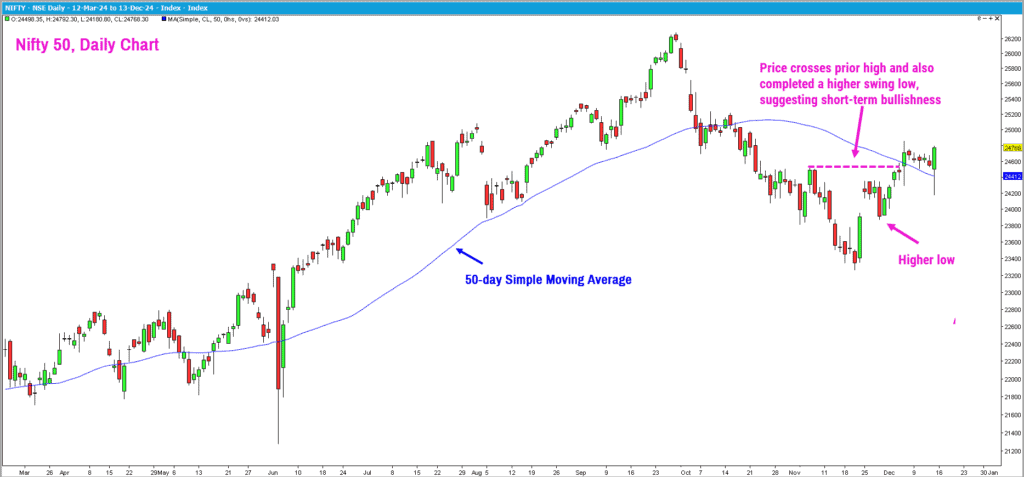
However, in the short-term, there is a possibility of a cool off to happen. The index can either get into a time-consuming consolidation or there could be a pull-back in price. Either of these options will help the short-term breadth cool off a wee bit. This can set the stage for the next upward move.
The other, less likely scenario is a resumption of the prior downtrend which could push the Nifty 50 index to drop below the recent low of 23,260. A look at the breadth indicator of broader markets’ overheated condition indicates the possibility of the cool off scenario suggested earlier.
The speed and extent of this anticipated pullback would determine what is in store for the Nifty 50 index in the short-term. The resistance zone at 25,000-25,300 and the support zone at 23,600-23,800 are the levels to watch out for. A breach of either of these levels would set the tone for the next major move in the index.
Seasonality-wise too, December is a month where the Nifty 50 index has the tendency to deliver positive returns. Looking at the data from the year 1996 indicates that the index has delivered positive returns 75% of the time, with average return of 3.45%. Given this backdrop, there is a case for the recent recovery to extend a little further up to 25,400-25,600 zone.
Small and midcaps
Now, let’s move on to the other market segments outside the bellwether Nifty 50.
Nifty Midcap 150 index
The midcap index has seen a sharp recovery recently and the relative performance versus the Nifty 50 index has improved alongside. The chart below captures the Nifty Midcap 150 index along with the relative performance captured as a blue line.
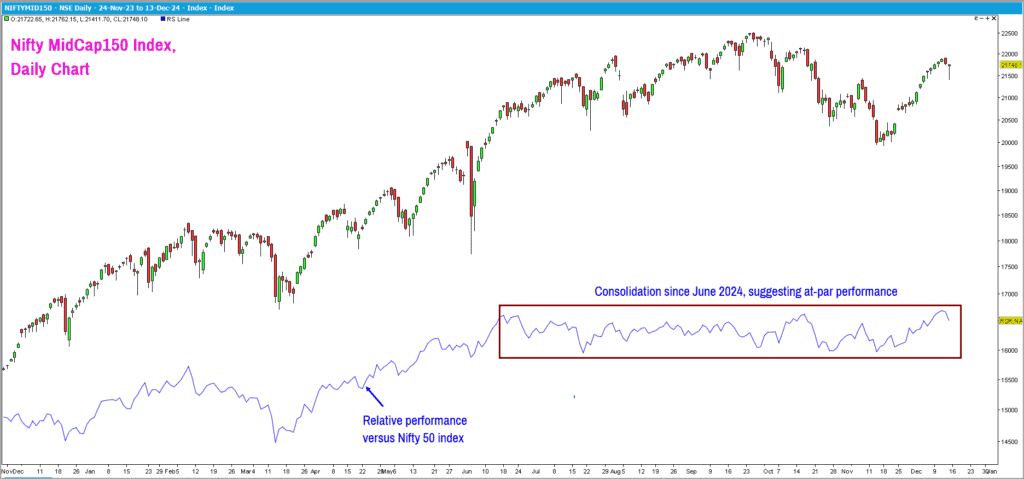
The relative performance line has been consolidating in a range for a while now, suggesting that this index has performed in line with the Nifty 50 index since June 2024. Wait for a breakout in the relative performance line before enhancing exposures in midcap stocks.
From a technical perspective, the midcap index is close to its key resistance level at 22,150-22,300. A breakout above this zone along with a breakout in the relative performance line would be the basic requirement before turning bullish in midcap stocks. A drop below 19,800 would be a sign of weakness and could open significant downside in the midcap index.
Nifty SmallCap250 index
The smallcap index is trading very close to its all-time highs but has struggled to move above the key resistance in the 18,600-18,800 zone. A breakout above 18,800 would lend momentum to the upside. Until then, remain light and avoid big exposures in the small-cap space. Above 18,800, the index could rally to 20,500-21,000. A fall below 16,500 would be a cause of concern and could open up further downside in the smallcap index.
Sector indices
In this report, we revisit the heavyweight sectors of banking and IT, along with other interesting themes.
Nifty Bank index
We had highlighted in the previous update about the relative outperformance of this index in relation to the Nifty 50 index. This outperformance still persists even though the Bank index has been confined to the broad range of the 49,000-54,500 zone.
The swing low at 49,000 is the key level to focus on the downside. A breach of this level could impart downside momentum in the Nifty Bank index. A move past 54,500 would open up further upside potential in this index. Keep an eye on 49,000 & 54,500 to ascertain the next trending move in the banking universe. The way this index behaves would have a big influence on the movement in the Nifty 50 index.
Nifty IT Index
This index has been a strong performer in the past several months and remains one of the more bullish sectors. The IT index is trading at all-time highs even as the Nifty 50 index is still some distance away from this level. The short-term outlook for the IT index is bullish and a rally to the next target zone of 47,500-49,000. The bullish outlook would be under threat only if the IT index drops below the 39,000 level. Keep an eye on this sector and look for exposures from the IT space if the Nifty 50 index sustains its recent upward trajectory.
Nifty India Digital Index
This index is an interesting one and is also one of the strongest sectors at the moment. Here are the top 10 stocks in terms of weightage in the Digital index.

This index is trading at all-time highs, suggesting bullishness. The immediate target for this index is 10,600-10,800. The bullish view would be invalidated on a fall below 8,900. Keep an eye on this segment and it could offer interesting investment / trading opportunities if the Nifty 50 index does not resume its downtrend.
Nifty Realty Index
This sector has been a terrible underperformer since June 2024. It may be recalled that the realty sector was one of the top performers during the bull run that commenced in April 2023. After a strong rally, this index turned a relative underperformer in the past six months. The recent price action suggests that the buying interest is creeping into the realty stocks.
While it is recommended to wait for more confirmation, there are early signs that this sector may regain its mojo soon. Watch for breakout above 1,200 in the Nifty Realty Index. A move past 1,200 could impart bullish momentum in the realty index.


12 thoughts on “Technical outlook: Key index levels for the Nifty 50”
Hi, NIFTY 50 has closed below the resistance levels quoted in the article. Guidance on these may help:
1. Is it opportune to do some bottom fishing at this juncture.
2. Assuming that this breach may lead to further downslide, what are the levels to watch out for.
Thanks.
We will be publishing the next index outlook in a few days’ time. Please look out for it. – thanks, Bhavana
sir, Your analysis is very helpful can you please help on this point and figure breadth indicator how to use with one diagram.. Thanks
sir, can you please help on this point and figure breadth indicator how to use with one diagram.. Thanks
Hello:
Point & Figure chart is unique and the price action is captured through alternating columns of X & O. A column of X represents rising price & column of O falling price. To calculate the PF-X% indicator, we look at the number of stocks from a group where the last column is a column of X. Simply stated, we are looking at stocks that are currently in a bullish swing. For the Nifty 50 universe, I prefer a 1% box size to plot the Point & Figure Chart.
Here is the Point & Figure chart of Reliance Industries plotted in 1% box size.
For every constituent of the Nifty 50 index, we can check if the last column is a column of X or not. If it is a column of X, then the stock would be included in Pf-X% breadth calculation. The Pf-X% value is now at 46% suggesting that 23 out of the Nifty 50 stocks are in a column of X in 1% box size.
PF-X% above 75 is considered overbought and reading below 25 indicates oversold condition. Here is the PF-X% breadth indicator chart of Nifty 50 universe.
Notice how the indicator oscillates between overbought and oversold conditions. You can also watch out for divergence between the price action and the indicator to glean further insights.
Hope this provides a basic idea of the breadth indicator. There is a ton of literature on the basics of Point & Figure chart at Definedge YouTube channel. Watch them for more details.
B.Krishnakumar
Thanks sir for detailed reply
Is there any article explaining what this breadth indicator is, where/how we can check it and how it impacts market?
Hello:
There are many different breadth indicators that are available. Breadth indicators can be calculated on candlestick charts or on other charting methods such as Point & Figure or Renko. I typically use the percentage of stocks trading above their 20-day moving average in candlestick charts as a default short-term breadth indicator. I also use the percentage of stocks in a bullish swing in Point & Figure chart.
There are multiple resources to study and track these breadth indicators. I am using the TradePoint & RZone web platform for tracking breadth. These platforms are offered by Definedge Securities. I am sure there could be lots of free resources online that offer basic breadth data for free. But for Point & Figure based analysis, Definedge is among the best.
Hope this helps
B.Krishnakumar
Thanks for explanation. I understood % of stocks above 20 DMA. But , didn’t understand the bullish swing in Point & figure chart part. will check on this.
From this article and explanation, I understand the usage of breadth indicator could be subjective and depends on expertise/experience of the person analyzing.
Hello:
The usage is fairly simple and straightforward. There are levels to decide overbought and oversold conditions in breadth. But how to interpret and integrate this with price action involves some experience and expertise. Not too difficult for sure.
Regards
B.Krishnakumar
Hi Krishnakumar
Thank you for the insights on the sectors.
This article had become valuable for naive investors like us.
Good Article. Thank you
Comments are closed.