The author is an external contributor. Views are personal and do not reflect the opinion and views of PrimeInvestor.
In the previous update on the Nifty 50, we suggested a cautious approach and highlighted the rangebound price movement in Nifty 50. While there is not much change to this thought, let us dive deep to understand the current technical structure and what to expect in the near term.
As always, we shall take a closer look at the short-term chart of Nifty 50 index along with the breadth indicators to assess what is in store in the near-term. We will also discuss the sectors that are displaying relative strength and weakness.

Nifty Short-Term Outlook
We had highlighted in the previous update that the Nifty 50 index has to break out of the zone marked by 23,900-24,100 on the lower side and 25,200-25,400 on the higher side for a decisive movement. Though the index managed to poke above the upper end of the range, this breakout was short-lived and the price has retraced back into the prior range.
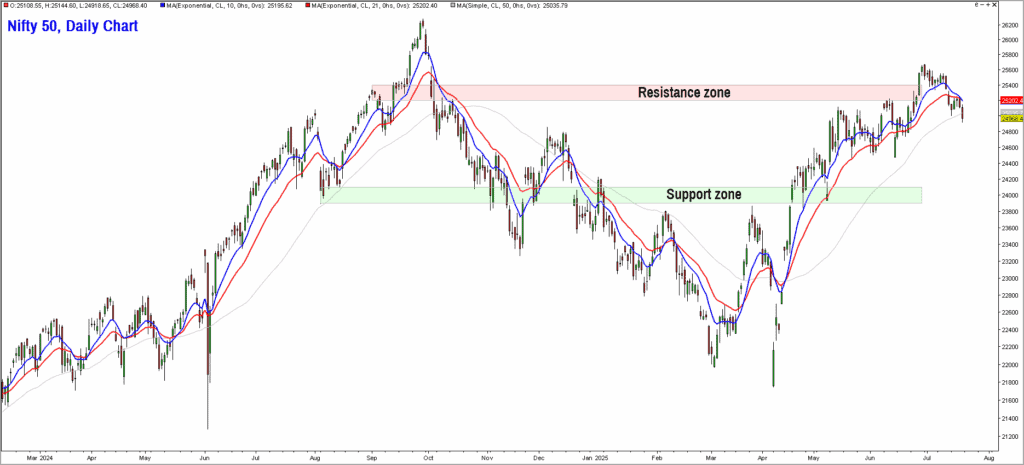
The inability to sustain and progress beyond the 25,200-25,400 range is a sign of weakness. It is also evident from the above chart that the price is tracing out a bearish sequence of lower highs and lower lows in the past few weeks. More importantly, the price has closed below the key 21-day exponential moving average, again suggesting weakness.
Not just that, the Nifty 50 index has also closed below another key level – the 50-day moving average. Unless there is a quick recovery and a breakout above the recent high of 24,700, expect range bound and a downward drift in Nifty 50 index.
As highlighted in the prior update, the persistent negative divergence between the price action and the short-term breadth indicator for the Nifty 50 index remains another cause of concern. While the Nifty 50 index has managed to scale higher highs in the past few months, the PF-X% breadth indicator has not kept pace and has traced out a lower high pattern, suggesting lack of participation from the constituents of the Nifty 50 index.
The recent outperformance of the precious metals versus Nifty 50 is another worrying factor. In essence, it is time to be cautious about equity markets in the short-term. Until there is a breakout above 25,700, it would be advisable to remain cautious and avoid fresh exposures in the equity market.
Small & Midcap and sector indices
With the Nifty 50 on a cautious note, let’s take a look at what the mid-and-small cap component of the market is doing. We’ll also take a quick look at sectors that are bullish and outperforming Nifty 50 and the underperformers.
#1 Nifty MidSmallCap 400 Index
As highlighted in prior updates, this index has displayed signs of relative outperformance versus Nifty 50 in the past few months. This index continues to remain bullish and the more important aspect is that the long-term breadth indicator is also displaying positive signs.
The percentage of stocks from this index that are trading above their 200-day moving average has improved considerably since the market recovery off the April 7 lows. The broader markets are therefore the segment to focus on for potential entry opportunities. Keep your shopping list ready and deploy the funds once the Nifty 50 index displays concrete signs of strength!
Technically, a fall below 19,000 would be a sign of weakness while a breakout above 22,100 would indicate that the index could head to fresh all-time highs and a rally to 23,500-24,000.
#2 Nifty Bank Index
This index continues to display relative strength versus Nifty 50 index. The Nifty Bank index managed to scale fresh all-time highs earlier this month even as the Nifty 50 index is yet to do so.
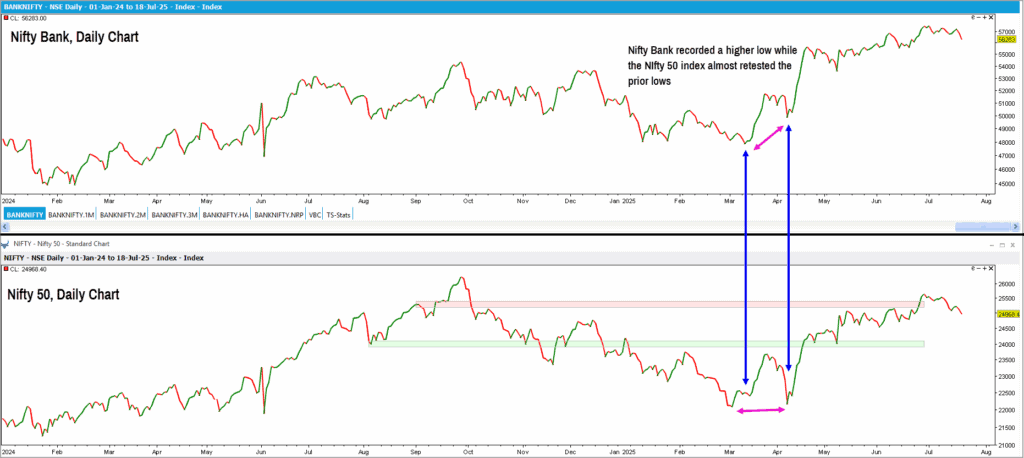
From a technical perspective, the Nifty Bank index has to sustain above the swing low at 53,000 level to remain bullish. A breach of this level would be a sign of weakness and would warrant a more cautious approach towards the banking sector. For now, Nifty Bank is showing signs of strength, but, await signs of bullishness in the Nifty 50 index before committing fresh exposure to banking stocks.
#3 Nifty Realty Index
We had highlighted this index as one of the promising sectors that is showing a lot of relative strength. The Nifty Realty index has managed to remain bullish and has been among the top performers recently.
The breakout above the resistance level at 1,042 is a sign of strength and the index appears on course to reach the next target zone at 1,150-1,200. Only a breach of 920 would be a sign of weakness and would warrant a reassessment of the positive outlook. As always, wait for the trend in the Nifty 50 index to turn bullish before taking exposure in this sector.
#4 Nifty Capital Markets Index
This is one of the more recently-launched indices by the NSE, and this index tracks the performance of stocks from the Nifty 500 index which represent the capital market theme. Here is the list of top 10 stocks from the index along with their weightage:

The Capital Markets index has been a relative outperformer, and the short-term outlook is bullish too. A breakout above 4,770 would be a sign of strength and could push the index to the next target zone at 6,300-6,500.
#5 Nifty IT Index
After some promise, this index has resumed its relative underperformance versus nifty 50. The short-term outlook is weak, and the index could slide to 33,500-34,000. Only a breakout above 40,000 would require a relook at the bearish outlook for the IT index.
To conclude, continuing from our previous update, it is still caution-time in the markets. Await fresh clues from the price action before taking any decision about enhancing equity market exposures. Keep an eye on the stocks from the outperforming sectors discussed above. Consider exposure in these sectors only after Nifty 50 resumes its uptrend.