Over the past decade, investors have gradually developed a keener eye for costs. Whether it’s the increasing adoption of direct mutual funds, discount brokers and fintech platforms democratizing access to markets, or even the regulator playing its part in bringing down expense ratios, costs in investing have dropped. Investors are also more aware of commissions and other hidden costs eating into returns.
But even investors get savvy on costs, building real wealth through mutual funds and stocks is still a struggle. Why?
Because costs solve only part of the investing problem. The bigger driver of returns and wealth is the portfolio itself – what goes into it, what the allocations are, what actions are taken to maintain the portfolio. Poorly constructed portfolios may be efficient on the cost front but will miss capitalizing on return opportunities.
At PrimeInvestor, we have spent years studying this through our portfolio review tool, analysing over 15,000 portfolios representing more than ₹25,000 crore of assets. More recently, onboarding investors into our PMS has taken us deeper into the world of real portfolios.
The patterns we see are illuminating, sometimes sobering, and always instructive.
Whether you invest with our PMS or manage your own money, these observations matter because they explain why many careful investors still end up with less wealth than they deserve.
The 4 Mistakes We See Most Often
Investors often assume that once costs are lowered, better outcomes naturally follow. But portfolio outcomes are shaped by much more than fees. We continue to see familiar problems:
- portfolios skewed too heavily to equity or too conservatively to debt
- rebalancing absent or accidental
- dozens of overlapping mutual funds
- stock portfolios with no sizing discipline or exit framework
In many cases, the issue is not a lack of effort or research. It is the absence of structure. Across the hundreds of portfolios we have now reviewed in our PMS capacity, there are 4 mistakes with portfolio structure that we see consistently.
1. Treating a Portfolio as a Museum of Past Decisions
A fund bought for tax saving and lost its performance and purpose, a stock bought on a friend’s recommendation, a thematic ETF that dipped after a rally, a stock preserved long after the thesis broke. Together, these create what we call a museum portfolio. There is no architecture, no exit discipline, and no clear sense of what each position is meant to do. The reason this pattern persists is almost always emotional: selling means admitting something did not work, and for many investors, that admission is harder than the financial cost of holding.
2. Failing to Decide How Much
Investors spend enormous time deciding what to buy and very little time deciding how much to own. But allocation is what converts analysis into outcomes. A strong idea sitting at 1% of a portfolio cannot move results meaningfully. A weak idea left at 10% can do serious damage.
And a stock that grew from 5% to 15% of a portfolio is no longer merely a winner. It may now be a concentration risk. Conviction without sizing discipline rarely compounds well.
3. Confusing Quantity With Diversification
Owning 20 equity funds is not diversification if they overlap heavily. Holding numerous small-cap stocks is not diversification if they all depend on the same market cycle. True diversification comes from combining assets and exposures that behave differently during stress across asset classes, risk factors and time horizons.
4. Holding Because of Tax
Perhaps the most expensive justification for inaction in investing is taxes. If you hold a fund delivering 4% annualised returns for three years while the benchmark delivered 10%, the tax on selling and reinvesting is almost certainly less than the compounding cost of staying invested. An ELSS fund that qualifies for a one-time tax benefit but underperforms every year also compounds – but in terms of the opportunity loss it is sufferring.
Real portfolio illustrations
Here are some illustrations to explain how the above mistakes happen in real portfolios.
Illustration 1 — The 136-Stock Museum
One portfolio we reviewed held 136 individual stocks with a total equity portfolio of approximately ₹1.3 crore. The top 10 positions accounted for just 19.8% of the portfolio. The largest single holding was barely 2.3% of the total. The remaining 126 stocks collectively held 80% of the capital, but were spread so thinly that most individual positions were between ₹20,000 and ₹1.5 lakh.
Consider this example: A well-regarded stock, rated as a ‘Strong Buy’ by us was sitting at 0.16% of a ₹1.3 crore portfolio — a position of roughly ₹21,000. Even a 100% gain on that stock would add ₹21,000 to a ₹1.3 crore corpus. The conviction was there. The allocation was not.
Of the 136 stocks in the portfolio, 74% had a weight below 1%. In practical terms, even if one of those positions doubled, the portfolio would move by less than 1%. The investor had done extensive research — there were some genuinely good ideas — but the sizing made all of it irrelevant. A portfolio this fragmented cannot be managed, cannot be monitored meaningfully, and cannot compound.
The reason for this is almost always the same: positions are added but never sized up, and nothing is ever exited.
In the same 136-stock portfolio, 33 positions were in companies with market capitalisation below ₹5,000 crore — what would typically be classified as micro-cap stocks. Several were below ₹1,000 crore. Apart from business risks they carried a big risk: limited liquidity (exiting even a modest position can move the price), lower governance scrutiny, and higher sensitivity to market cycles.
The result was a portfolio carrying the full volatility and liquidity risk of a micro-cap skew, without the concentrated upside that makes such risk worth taking. So, while the risk was real, the reward potential was not.
Illustration 2 – 53 Mutual Funds, overlap aplenty
A different investor held 53 mutual funds in a single portfolio worth approximately ₹5.26 crore.
Here’s the category breakdown: 7 small cap funds, 5 flexi cap funds, 4 mid cap funds, 8 thematic and sectoral funds, and 3 focused equity funds, among others. In total, these funds were sitting across 21 distinct categories. 14 funds had a weight below 0.5%, holding between ₹1,000 and ₹3.3 lakh each in a ₹5.26 crore portfolio. The variety in thematic funds – strategies that require active market-timing judgment to work well – also meant that it had the inadvertent character of a normal diversified portfolio.
At the portfolio level, all of this created massive overlap in underlying stocks, with the Nifty 50 names appearing across virtually every fund.
The investor’s total portfolio gain was healthy in absolute terms (without any comparison with similar pattern and period of investing in index). But the structure guaranteed that no single fund could drive meaningful outperformance. With 53 funds, the portfolio was also a high-cost one, where the investor was paying active management fees across the board but getting index-like diversification.
Illustration 3 — 70% of a Portfolio underperforming
In two related portfolios reviewed together (of a couple), 69–70% of total assets were rated Sell by our review tool. In one portfolio of Rs 2.34 crore, funds worth Rs 1.62 crore were exits due to severe underperformance. In the second portfolio of Rs 34.7 lakh, funds worth Rs 24.4 lakh were exits.
The pattern was concentrated in large-cap funds — three different large-cap or large-and-mid-cap funds were held alongside each other with material overlap and below-average ratings. These were almost certainly legacy holdings from a distributor-led accumulation phase, each purchased for a different reason at a different time. Together, they constituted the bulk of the portfolios, dragging on returns while the investor’s remaining capital in better-performing funds was too small to compensate.
The combined portfolio gain on the portfolio was 3.1% — not annualised, but cumulative, on a corpus of Rs 2.34 crore. We call it the compounding cost of inaction.
What Portfolio Construction Actually Means
Most investors think about investing as a collection of ideas: a fund here, a stock there, a thematic ETF because it rallied, an ELSS for tax saving. Each decision may be defensible in isolation. But a portfolio is not a collection of decisions. It is a system. And systems without architecture produce unintended outcomes.
Good portfolio construction answers a different set of questions from the ones most investors ask: not just what to buy, but what role each position plays, how large it should be, what it sits alongside, and what conditions would justify exiting it. This shift from idea selection to portfolio architecture is what most self-managed portfolios lack.
Professional portfolio construction typically involves three layers:
- Asset Allocation: Deciding how much of the portfolio sits in equity, debt, gold, and other asset classes — and when and how to rebalance. This single decision often drives a larger share of returns than any individual security pick.
- Portfolio Architecture: Within equity, structuring positions across a core (high-conviction compounders held for the long run) and a satellite (tactical opportunities, cyclical bets, sector tilts). The core provides stability while the satellite generates incremental alpha. Without this distinction, investors typically end up either too concentrated in a few winners or too diversified across too many ideas, with neither working well.
- Macro Overlay: Maintaining a view on where the economy, interest rates, liquidity, and sector cycles are heading — and adjusting exposure accordingly. Most retail portfolios are built bottom-up, one security at a time, with no regard for this layer. That makes them vulnerable to being in the wrong sectors at the wrong time.
Over a full market cycle, a well-constructed portfolio survives corrections with cash or dry powder ready to deploy. A poorly constructed one spends years just getting back to where it started.
Why Avoiding Losers Matters More Than Picking Winners
One of the most counterintuitive insights in investing — and one we hold at the core of how we build portfolios — is this: the biggest gains in long-term outcome come not from finding more winners, but from making fewer bad mistakes.
Pulak Prasad of Nalanda Capital, one of India’s most successful long-term equity managers, formalised this insight in his work drawing on evolutionary biology (read our review: Unlocking Nalanda Capital’s best guarded investment formula)
He describes two types of investment errors: Type 1 (owning something you should not have) and Type 2 (missing something that went up). His analysis of a large investment universe found that reducing type 1 error has increased the success rate by 16% while minimizing both types of errors only led to 2% further improvement (over reducing type 1 error). Missed opportunities are notional. Losses on what you own are real.
The mathematics of drawdowns makes this visceral: a portfolio that falls 50% needs a 100% gain just to return to its starting point. This essentially means falling less than the benchmark is a compounding advantage.
This is why good portfolio management often feels less exciting than popular investing narratives. It involves:
- rejecting more ideas
- trimming more aggressively
- maintaining role clarity of a pick in your portfolio
- and accepting that a disciplined ‘no’ today is worth more than an impulsive ‘yes’ that needs recovering from.
How We Build Portfolios: The PrimeInvestor Process
At PrimeInvestor, portfolio construction begins with a different question. Not simply: “Is this a good idea?” But: “What role does this play, how large should it be, and what should sit alongside it?”
That philosophy runs through our PMS strategies.
Prime Vision focuses on structured asset allocation across equity, debt and gold, reducing the need for investors to improvise risk decisions during volatile markets.
Prime Velocity applies a disciplined core-satellite framework in equities, separating long-term compounders from tactical opportunities while maintaining liquidity discipline.
Prime Synergy addresses a common reality in Indian investing — portfolios holding both mutual funds and stocks, often with overlap and little coordination — and attempts to integrate them within a coherent framework.
Different strategies. Same principle. Architecture before accumulation.
What the Numbers Show
The PMS strategies were launched in December 2025 and January 2026 — a period that proved immediately testing. Broad markets corrected sharply, with the Nifty 50 TRI falling over 7% in the months that followed. In this environment, every PrimeInvestor PMS strategy outperformed its benchmark since inception. The table below shows absolute returns net of all fees and transaction costs as of 30 April 2026.
These are early returns across a short window, and we are careful not to overstate them. What they demonstrate is not magnitude but resilience, which is what sound portfolio construction is designed to deliver.
The longer track record we built up in our previous research recommendation service makes this case more fully. The Core & Satellite ETF smallcase — managed by us using the same process — delivered a 3-year CAGR of 21.80% versus 9.93% for Nifty 50, an outperformance of 11.87 percentage points. The Prime High Growth portfolio, running since January 2020 on a monthly SIP basis, compounded at 16.78% CAGR against 9.95% for Nifty 50 over six-plus years — an outperformance of 6.83 percentage points annually.
Past performance does not guarantee future results. But it does confirm that the process described in this article is not theoretical.
Where the Remaining 70% Lives
Costs matter. But once you have solved for cost, what ultimately shapes long-term outcomes is as follows:
- where you invest
- how much you allocate
- how you rebalance and trim
- how you manage drawdowns
- and just as importantly, what you choose not to own
Whether you invest through PrimeInvestor or manage your own money, the discipline is the same:
- Move beyond collecting ideas.
- Start building architecture.
That is where the remaining 70% of a portfolio’s return lives.
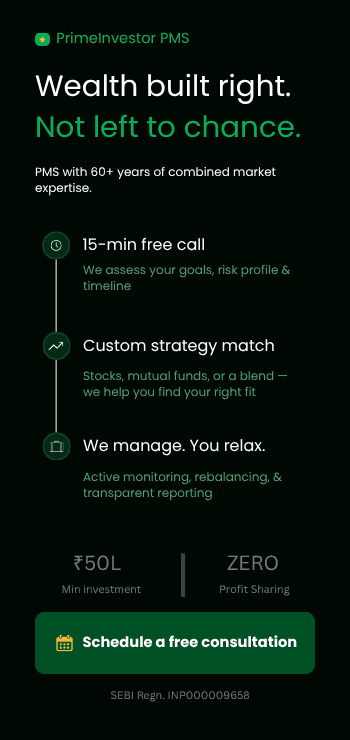
If you’re interested in knowing more about PrimeInvestor PMS, schedule a call with us!