With data and inputs from Bipin Ramachandran.
In our quest for the best asset allocation, we had looked an all-equity portfolio in our previous article and explained that 100% equity portfolios often don’t work in real life. This is because investors get tempted to exit them prematurely, when big losses arrive.
Our analysis showed that an investor who held an equity-only portfolio in the last 20 years would have had to put up with a 57% crash in his portfolio value in the worst year, while experiencing loss-making years 18.6% of the time. Many investors, especially new ones, may not fancy a ride in such a bumpy roller-coaster and may hop off midway.

Asset-allocated portfolios give you better confidence to buy and hold, because you face much lower return volatility and make lower losses in bear markets.
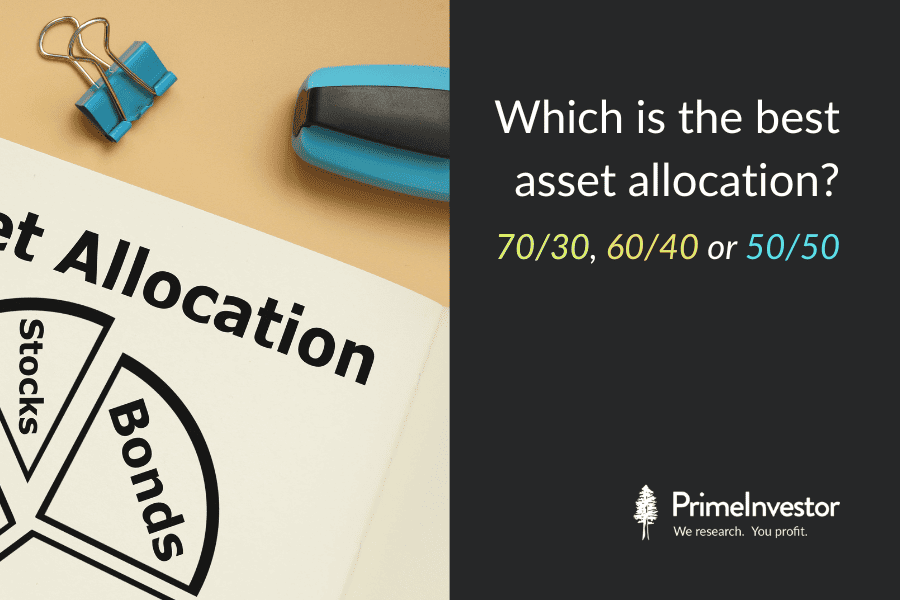
So, what should your ideal asset allocation be? Should you go for a portfolio with 60% equity and 40% debt? Or will other combinations like 50/50 yield better results?
No single best asset allocation
There’s no single combo that is best for every investor. Investors should set their asset allocation based on their objectives. An investor who wants to get to a 10% return with manageable losses needs a very different asset allocation from one who wants to max out his returns.
This is why, to figure out what different asset allocation patterns deliver to the investor, we ran a rolling return analysis for different equity-debt combinations. The results we have presented below are based on real-life returns on equity and debt in India in the last twenty years. In this analysis, equities were represented by the Nifty100 index and debt by SBI Gilt Fund (long history). The data below is derived from a rolling 1-year return analysis from January 2003 to February 2024.
The table shows the point-to-point portfolio CAGR for each equity/debt combo, its average 1 year rolling return, its maximum and minimum annual returns and other measures like Sharpe Ratio, proportion of lossmaking periods and periods with returns that topped 12%.
Takeaways from the data
- One simple way to use this data is to see the range of your target returns and choose the appropriate asset allocation from the table. For example, even if your return expectation is, say, 12-15%, this data will tell you that you need not take very high risk to achieve it. A 70:30 portfolio actually delivers superior risk-adjusted returns (sharpe) with probability of earning over 12% not too different from a 100% equity portfolio. So this data will tell you that you need not go all out on equity to achieve your returns. But do remember, you cannot have an unrealistic return expectation and hope you will never lose money. When some of you write to us asking for 15% return with no risk of loss in any year, the above data should remind you that it is not possible.
- The data shows that higher your target return, the more your equity weights should be. This is obvious, but you will notice that in the last 20 years the Sharpe Ratio was the lowest for equity-heavy portfolios and improves as the investor added debt. The Sharpe Ratio of a portfolio is a statistical measure of how much returns you earned for every unit of risk taken. The data tells you that significant improvements in Sharpe can be achieved even by adding 20% debt to a 100% equity portfolio. The ratio gets better as you add in more debt. But it peaks out when you get to a 30-70 combination. Adding debt weights beyond 70% doesn’t improve your risk-adjusted return. This goes to show that if you’re keen on maximising returns per unit of risk, 40-60 or 30-70 portfolios do the trick.
- Higher the equity weight, higher are the losses suffered in the worst years as well as lossmaking years. But the data shows that by moving from 100% equity to a 60-40 portfolio, the investor could reduce the maximum draw-down he suffered from a stomach-churning 57% to a more bearable 33%. A 60-40 portfolio also subjected the investor to losses only 11.9% of the time instead of 18.6% with an equity-only portfolios. A 100% equity portfolio delivered a portfolio CAGR of 15.86% against 13.5% on the 60-40 portfolio. Many folks may find the 2.36 percentage point sacrifice in returns, worth it if they can trim draw-downs and the lossmaking years materially. In fact, the results for a 60-40 portfolio could be better in future if equity markets do not crash as much as they did in 2008 (when they sank 57% on the back of the global financial crisis).
- Moving from a 60-40 to a 50:50 portfolio very substantially trimmed the investor’s draw-downs. It reduced the maximum loss from 33% to 26.1% while making losses less than one-tenth of the years, against about 12% of the time with 60-40. A 50-50 portfolio still managed an average 1-year rolling return of 12.9% while a 60-40 portfolio delivered 14%.
- For conservative investors, the good news is that you didn’t need an equity-heavy portfolio to get to a double-digit return. In fact, moving from a 60-40 to 40-60 portfolio in favour of debt, cut the investor’s returns by less than 2 percentage points from 13.5% to 11.7%, still decent return. It also trimmed the maximum loss from 32.3% to 19.9% and the probability of losses from 11.9% to 7.6%.
- 40-60 or 30-70 portfolios may thus be ideal for retirees who would like to minimise draw-downs in capital. They would also work well for conservative investors who would like to participate in equities without losing too much money in bad times.
Finally, you’d have noticed that no amount of juggling the asset mix in the above data, could deliver a Sharpe ratio above 1 or lead to zero lossmaking periods. This is because this analysis is based wholly on rolling 1-year returns. Even if you hold a small proportion of equities in your portfolio, one year is too short a holding period. In our future articles on this subject, we will be dealing with rolling returns over 3-, 5- and 10-year periods as those lessons will be more useful for seasoned investors who can take yearly drawdowns.


42 thoughts on “70/30, 60/40 or 50/50: Which is the best asset allocation?”
Isn’t clear if rebalancing has been considered. For example, does a 70:30 portfolio mean it is the starting mix or is it rebalanced every year/half-year/quarter. Guess the article is missing on this crucial aspect. Please respond. Thanks!
Yes, rebalancing is done. Every portfolio is rebalanced annually to restore to its original allocation.
Excellent Article Aarthi Ji… Like youmentioned at end of article, can you please post the analysis of 3/5/7/10 year periods?. It will really be of immense help to my portfolio plan for retirement. (Just FYI- Have planned a 50-50 portfolio to feed my retirement SWP debt fund, every 5 years)
Madam Thanks for your comments . At current peak of the bull run does it make sense to adopt a 25% equity 75% debt and should one reserve funds for tactical buying . When the six-month moving average (6MMA) is less than the 12-month moving average (12MMA) then perhaps move to cash or else buy equity.
While the asset allocation is a very personal choice..I have found cutting back too much on equity in bull mkts makes redeployment a big problem. Very hard to invest 39-40% after a fall when you know further falls can come..also tough to find enough opportunities and execute
I am avoiding the profit booking part but instead directing new investments to either debt or hybrids that currently have lower equity levels like Parag DAA. When the market falls switch strategy and allocate to flexicap funds. There is a problem here though that we don’t know how long the bull run would last (when Nifty was 19.5K I thought its a bubble!!) with the force of retail liquidity even when FII are selling and I hear that super star investors are selling.
In general most experts seem to agree that valuations are high but its not a bubble. Overall the decision making would comprise of:
1. Your current age
2. How far away is your goal
3. How much of experience do you have in the stock market?
4. Have you been through a bear phase?
5. What is the minimum allocation to equity do you need to achieve the target corpus – How defensive can your investment be but still has a fair chance to hit the target?
Most often people think they can handle the risk without actually having proven experience to handle it. I always look at the CAGR of my portfolio vs required CAGR for my end goal and decide how much of a risk is really needed and how much defensive can I get.
That’s a good approach!
This is one the best Articles I have recently seen. This is immensely useful for investors like me who want to take data driven investing approach and not just based on guts. I request you to cover the following in your future articles in context of this article:
a) How portfolio mix should change based on age of investor? (e.g. I changed my portfolio mix for equity-debt from 70:30 when I was in 20s and 30s to 40:60 ratio today when I am in late 40s).
b) Should an investor change his allocation ratio depending on market valuations to ensure adequate re-balancing and optimise the returns? If yes, what should be the guiding factor?
Regard
Amit
Thanks! Interesting suggestions. We will consider these in the future.
Request revert
The article we have published today tells you what asset allocation you should follow for differing time periods.
The article we published today shows that your allocation should change based on number of years to the goal. We have found that changing allocations based on mkt valuations is quite dicey. Better to go by extent of returns and weights in portfolio
Well written and data driven article. Just wanted to know if the debt portion is via EPF, do we still need to book profits in equity MF and invest in another debt fund.
yes rebalancing helps reduce risk.
Comments are closed.