With the Nifty 50 falling more than 15% from its peak and broader markets facing steeper drawdowns, many investors are questioning whether they should stop their SIPs. Our answer is a definite No. We have explained why in detail in our article: Mid & smallcaps – Why Naren’s advice isn’t for everyone – PrimeInvestor.
But if you continue your SIPs through this challenging period (especially if you believe you invested in a peak and see the markets crumbling soon), a critical question remains: When can you expect your portfolio to break even? While no one can predict future market movements with certainty, examining SIP performance during past market crashes provides valuable insights. We’ve analyzed how SIPs initiated just before previous market peaks performed through downturns and recoveries to help you set realistic expectations and maintain investment discipline during volatile periods.

What we analyzed
We examined monthly SIPs that began at elevated market levels. As markets declined, SIP investors saw their investments in the red. We measured how long it took for their SIPs to break even, assuming they continued without interruption. Additionally, we evaluated how the SIPs fared after 3 years and 5 years from their starting point.
To understand how different market cap segments reacted to market crashes, we conducted this return analysis for various indices, including:
- Nifty 100 TRI (large caps)
- Nifty Midcap 150 TRI (mid caps)
- Nifty Smallcap 250 TRI (small caps)
Note: Our calculations assume that SIP investments were made on the first business day of each month during the analysis period. Returns were measured as of the last SIP instalment date.
Global Financial Crisis
# 1 Starting at the peak
The Indian markets peaked in January 2008 before experiencing a sharp decline throughout the rest of 2008 and into 2009. In 2008 alone:
- The Nifty 100 TRI fell 53%
- The Nifty Midcap 150 TRI dropped 65%
- The Nifty Smallcap 250 TRI declined 69%
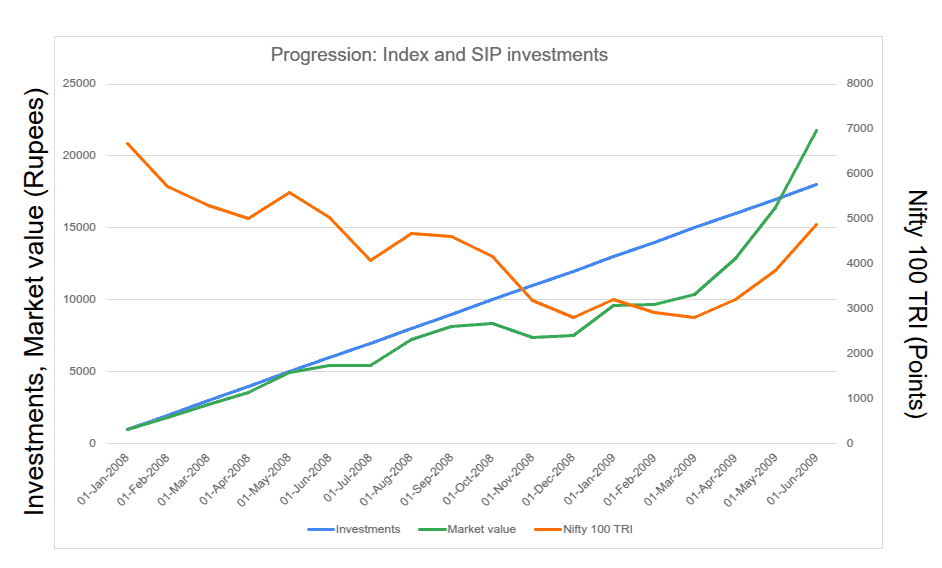
First let us analyze SIP performance for investors who started a Rs.1,000/month SIP in January 2008 in the Nifty 100 TRI index. This was just before the crash began. Here’s what we found:
- It took 18 months (18 SIP investments) to break even
- Soon after such breakeven, in the very next SIP instalment date the Rs.18,000 invested grew to Rs.21,800, delivering an XIRR of 29.65%
- The index was still well below its peak when the break-even occurred.
We then examined SIP performance across various indices. Despite different correction levels of each index, all SIPs in different indices turned positive within the same period and delivered comparable returns.
The data shows high XIRR in the month of break-even because this particular rebound was unique for Indian markets. After bottoming out in March 2009, the markets were on a slow recovery path. However, on 18th May 2009, markets surged over 17% in a single day following an election outcome that the market took very positively. This unexpected jump brought all SIPs into the green and lifted XIRRs.
What this episode goes to show is that, if you’ve started SIPs for the long-term, it is best to persist. Positive surprises from the market can spring up anytime and when they do, it doesn’t take much time to get to a healthy return.
Beyond Break-Even- 3-Year and 5-Year Returns: Next, we examined how continuing SIPs beyond the break-even point impacted returns. We looked at two timeframes: 3 years and 5 years from the starting date of the SIP.
You can see that small-cap SIPs were the slowest to recover. After 5 years, they delivered about 2 percentage points lower per year than large-cap SIPs. A closer look at the trajectory reveals that small-cap SIPs went back into losses in January 2012 after markets faced another steep correction in 2011:
- Nifty 100 TRI: -25%
- Nifty Midcap 150 TRI: -31%
- Nifty Smallcap 250 TRI: -35%
Despite this, investors who continued their SIPs (into 2012) saw modest gains by the end of the 5-year period.
# 2 SIPs started in a rallying market well ahead of peak
Since markets saw a steady fall from 2008, which resulted in most subsequent purchases being made at lower values, we rewound a bit to look at those investors who began SIPs a year before the crash in January 2007. This scenario may be more relatable to those who started SIPs in early 2024 and are currently seeing losses.
Note: The SIPs started in 2007 January would have seen gains until the markets turn negative in 2008. The breakeven we looked at in this case is post the 2008 crash.
Key findings:
- Breakeven occurred in June 2009, 30 months after starting the SIP (Index: Nifty 100 TRI)
- The Rs.30,000 invested grew to Rs.34,200 that month, lifting the XIRR to 11.27%
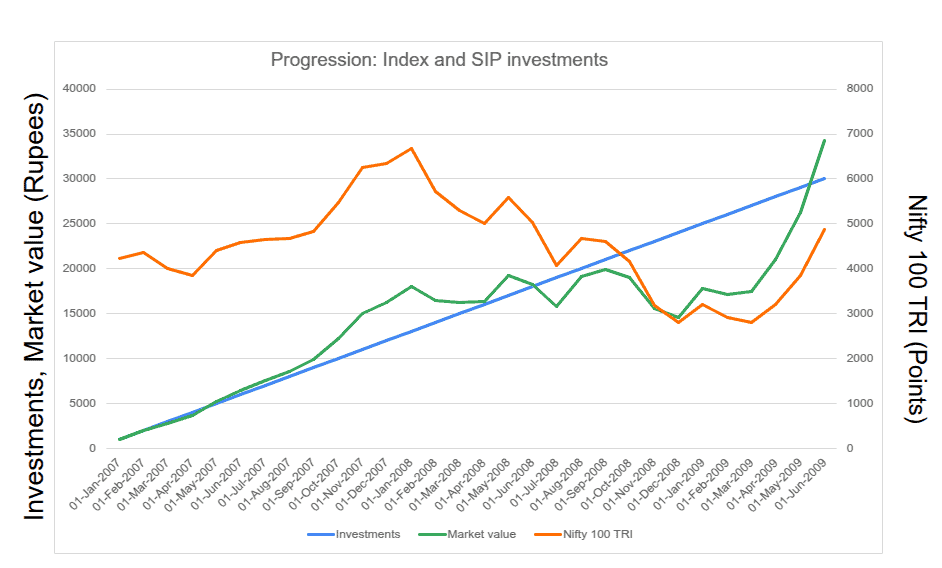
Once again, all indices turned profitable in June 2009, following the historic single-day market rally in May 2009. However, mid and small caps delivered lower returns. This goes to show that small-cap or mid-cap SIPs started during the last legs of a bull market take much longer to deliver healthy gains than large-cap SIPs.
Extending the SIP period to 3 and 5 years: 3 Year SIPs saw healthy returns. But the 5 year SIP ending at an unfavourable point (near the bottom of a bear market in 2011 December) dented returns with Smallcap SIPs barely in the green.
Extending the SIP beyond 5 years: A 5-year SIP delivering savings bank returns is hardly what a disciplined investor hopes for. So, we extended the January 2007 SIP beyond five years to see how performance varied. While adding one more year did improve returns, the increase was marginal. The XIRR of the small-cap SIP at 7.38% was even lower than debt fund returns at the time. Extending it by another year led to a shock, as the 2013 taper tantrum wiped out much of the previous year’s gains. Small caps were hit the hardest, causing the XIRR to drop to just 2.78%. However, extending the SIP for yet another year rewarded investors handsomely, with returns rising to around 15%.
Interestingly, the semi-aggressive indices—Nifty Large Midcap 250 and Nifty 500 Multicap—ended the 8-year SIP with higher returns than the small-cap SIP, with far less pain along the way.
COVID Crash
# 1 SIPs started at peak
Unlike the global financial crisis, where recovery took a long time, the COVID crash and rebound were swift. Markets recovered their losses within 2020 and continued climbing. To analyze SIP performance during this period, we examined SIPs starting in January 2018. Largecap stayed slightly positive from January 2018 to January 2020, meanwhile Mid and Small caps were seeing losses - making this an interesting period to analyze how SIPs performed for different market caps.
Findings:
- Nifty 100 TRI SIPs took 32 months to break even post Covid Crash if you has started SIP in January 2018.
- Rs.32,000 invested became Rs.32,400, with an XIRR of 1%
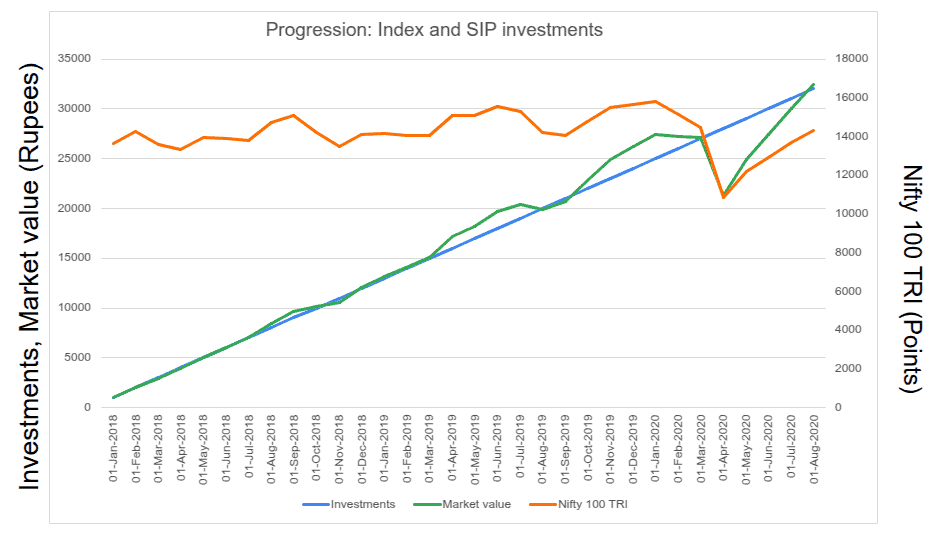
Other indices took a month or more than what the Nifty 100 took, to recover from the Covid crash, assuming those SIPs were also started in January 2018.
Continuing the SIPs for longer periods resulted in varying outcomes:
- The midcap index outperformed large caps over 3 years, while smallcap index underperformed.
- The smallcap but caught up to midcap over 5 years; both small and midcap outperformed Largecaps over 5 years.
With markets continuing to hit new highs post-COVID, SIP investors benefited across market caps for staying invested for longer term.
Continue Your Own Analysis
We have examined specific periods, but you can conduct your own analysis using our tool, which covers from April 2005 to February 2025.

Important: The spreadsheet is not compatible with some older MS Excel versions. If you encounter errors, follow these steps:
- Download a fresh copy of the tool from the article.
- Sign in to Microsoft OneDrive with a Microsoft account.
- Upload the tool to OneDrive.
- Open the tool from OneDrive in a web browser.
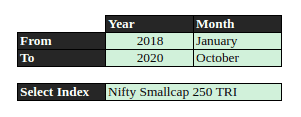
How to Use the Tool
- Enter the start and end month of the SIP. The SIP period will be inclusive of both of the months.
- Choose the index for analysis from the six available options:
- Nifty 100 TRI
- Nifty Midcap 150 TRI
- Nifty Smallcap 250 TRI
- Nifty 500 TRI
- NIFTY Large Midcap 250 TRI
- NIFTY 500 Multicap 50:25:25 TRI
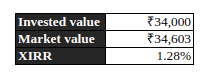
The tool will generate:
- A chart displaying investment amounts, market value, and index trends.
- Total invested value, market value, and XIRR as of the last SIP date.
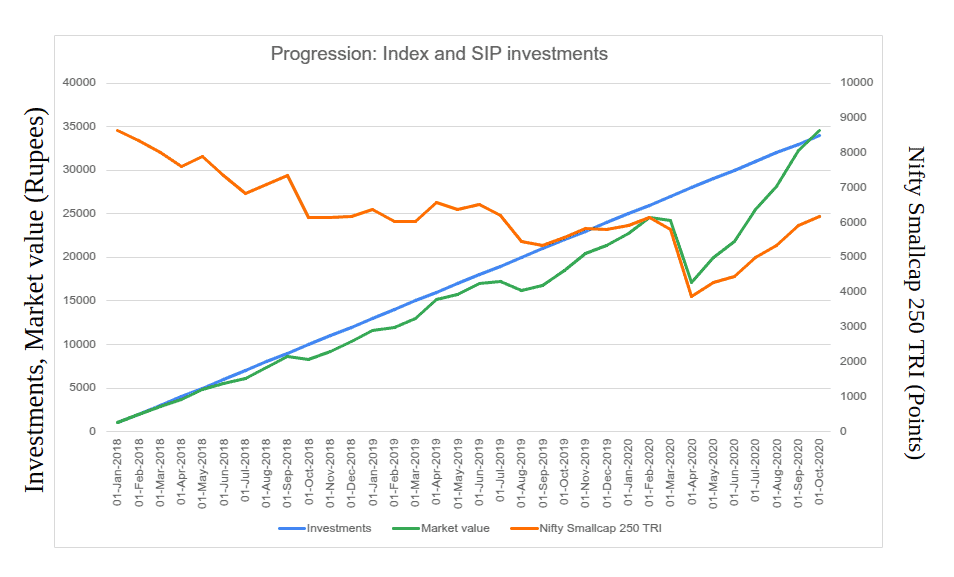
The investments (blue), and market value (green) values are given on the left hand side of the axis. The selected index value (orange) is given on the right side of the axis
Note: For very long durations or negative SIP returns, XIRR may not always provide accurate results.
Key Takeaways
- The nature of SIP as an averaging tool: SIPs work by averaging your purchase costs across market cycles, but this averaging mechanism functions differently depending on market direction. Our Global Financial Crisis analysis reveals an interesting pattern: SIPs started at the January 2008 market peak recovered faster than those started in January 2007 during the pre-peak rally.
- This counterintuitive result occurs because investors who began in 2007 accumulated units at higher valuations during the bull market, inflating their average cost basis. When markets crashed, these investors needed more time to break even despite having more accumulation time.
- Conversely, those who began SIPs right at the 2008 peak immediately benefited from acquiring more units at progressively lower prices as markets fell, creating a lower average cost that recovered more quickly when markets eventually rebounded.
- This highlights an important SIP characteristic: market timing entry points is virtually impossible, and sometimes seemingly "worse" timing can produce faster recovery. What matters most is maintaining discipline through market cycles, as our analysis shows that regardless of entry timing, SIPs do break even within reasonable timeframes when consistently maintained.
- Recovery timeframes differ by market cap: Small and mid-cap investments generally take longer to recover than large caps during market crashes, sometimes requiring 7+ years rather than the standard 3-5 year investment horizon many investors expect. So to keep a minimum 5 year investment horizon for large caps and minimum 7-year holding for small and mid-cap would be the conclusion one can draw from the analysis. This is also the primary reason why one cannot go overboard on small and midcaps. Diversification reduces the risk of your portfolio staying in the red for too long.
- SIPs don’t guarantee returns: A SIP doesn’t always end with good returns. Market crashes can still wipe out a significant portion of wealth accumulated over time. Specifically, higher risk does not guarantee higher returns. The data shows small caps took time to recover or even underperformed large caps (please note that we are talking of just indices here).
- SIP averages entry prices, not exit risks: While SIPs effectively manage entry risk through cost averaging, they offer no protection against exit timing risk. Your final returns heavily depend on market conditions when you withdraw your investments. Consider this striking example: A 4-year SIP in Nifty 500 TRI ending in May 2009 delivered a negative XIRR of -0.25%. However, delaying withdrawal by just one month resulted in a dramatic improvement to 12.93% XIRR—even though 98% of the investment period was identical. This significant disparity leads to two practical recommendations:
- If your SIP reaches your financial target ahead of schedule during favorable markets, consider moving those funds to safer investment options to protect your gains.
- If your SIP hasn't met your targets and markets are down, extending your withdrawal timeline even slightly can substantially improve returns.
This reality calls for building flexibility into your investment planning. We recommend setting minimum investment horizons of 7 years for large-cap SIPs and 10 years for small and mid-cap SIPs. Even if you stop contributing to SIPs earlier, being able to delay withdrawals during market downturns can significantly enhance your long-term returns.
Conclusion: Only patience rewards
Perfect market timing might theoretically beat systematic investing, but consistently predicting markets remains impossible. SIPs remove timing pressure while enforcing investment discipline—preventing diverted funds from becoming consumption.
SIPs started at market peaks or in volatile segments like small-caps may test your patience with underwhelming interim returns, as your portfolio value fluctuates with market conditions rather than reflecting long-term prospects.
The key insight is straightforward: maintain a minimum investment horizon of 5+ years (and more for small caps), and SIPs can consistently reward your patience. Market cycles eventually work in your favour when given adequate time—making SIPs the most reliable wealth-building strategy through all market conditions.


9 thoughts on “When will your SIPs break even?”
Would you recommend making lump sum investments into folios that already have SIPs in place? This could potentially lower the average cost price more quickly. Of course, the investor would need a long-term horizon for these lump sum investments as well.
Hello,
Making lump sum investments inevitably involves market timing, and there is a possibility that markets will continue to fall. As long as you are comfortable with this risk and ready to hold the investment for the long term, as you’ve suggested, you can consider it—provided the amount is not too large compared to your existing portfolio.
You may read the article below or watch the accompanying video for more details:
When is it fine to make lump sum investments?
A systematic approach is to monitor your asset allocation and check how much it has deviated from the intended allocation. If it has moved by more than 5%, rebalance it to the original allocation while continuing your existing SIPs.
Please refer to the tool below:
Portfolio Rebalancing Calculator | PrimeInvestor
Best regards
Bipin Ji. Once again an excellent analysis. Thank you… I have a question… Similar to an SIP, what may be a reasonable time for break even of a lump sum investment which was done during the market peak.
Thank you!
The challenge with lumpsum investments is that returns depend on single entry and exit points. If we look at the 2008 market peak, a lumpsum investment in the Nifty 50 stayed in the red for both 5 and 6 years and turned positive only in the 7th year. However, if we look at the 5-year rolling returns of a Nifty 50 index fund over the past 15 years, instances of negative returns were less than 2%. This means that investing at the exact market peak—where even a 5-year lumpsum investment couldn’t break even—occurred in less than 2% of cases over the past 15 years.
Thanks!
Thank you Ji. Very clear explanation. Very useful!!
This is an Ultra Wonderful analysis . Suggesting Mr Bipin to copyright this work. No where I have seen such an analysis. Thank You for the insight. Also, things may have been different if any one had topped up the SIP when Market fell 20% (Top up from 20% Fall till reached bottom and till it came back to the point of 20% fall and stop the topup, continue regular SIP). Great JOb. This is what Primeinvestor is different from others .
Thank you! Glad you found the analysis useful.
Regarding top-up SIPs during market crashes—interesting point! A historical analysis for a selected period would show better returns. However, the challenge is determining whether this would be a better strategy for wealth creation where future market movements are unknown.
Consider this hypothetical example: An investor has a 10K SIP. The market downturn continues, and the Nifty breaches 21,000 (a 20% drop from the peak). The investor increases the SIP to 15K. A year later, Nifty hits bottom and rebounds above 21,000, prompting the investor to revert the SIP to 10K. Now, suppose the market continues rising to 45,000 without another 20% crash (moves like that have happened in the past), then falls to 36,000. In this case, the investor might have been better off continuing the 15K SIP throughout the 21,000–45,000–36,000 range rather than reducing at 21,000 and increasing at 36,000.
Thanks!
The events that you have mentioned such as GFC, Covid are global crisis events which resulted in response primarily from Central Banks pumping in a lot of money to revive the economies. This time around – it is different – we have many local factors in play such as weak earnings, slowing GDP and other factors such as attractive valuations in other EM & dollar strengthening with rising US bond yields that is resulting in FII outflows. This could take a longer time to settle down & this would not be a V shaped recovery which we saw post the global crisis events (GFC, Covid etc)
Fair point; all crashes are unique. The 2013 market bottom was seen as a result of local issues. While external triggers played a role, India was part of the Fragile Five due to weak macroeconomic conditions and was among the worst hit. The provided sheet can be used to see how a SIP from 2012 performed after the 2013 taper tantrum.
Comments are closed.