The author is an external contributor. Views are personal and do not reflect the opinion and views of PrimeInvestor.
We had shared a bearish view in the previous update on the Nifty 50 and mentioned that the upside potential for the index was confined to the 25,000-25,300 zone. We had also emphasised that the market was vulnerable to further weakness.
As anticipated, the index recorded a high of 25,234 and turned weak thereafter. While the Nifty 50 index is now down 10.4% from the recent highs, the damage to the individual stocks is more severe. The indices do not capture the pain in the small and mid-cap universe. We will now assess the short-term outlook for the Nifty 50 index and a few sectoral indices.

Nifty Short-Term Outlook
Here is the daily chart of the Nifty 50 index. As highlighted in the chart below, the index is tracing out a bearish sequence of lower highs and lower lows. The price has also breached key moving averages including the 50-day moving average. We are now perched right at the 200-day exponential moving average which is one of the well-advertised and actively tracked metric by most market participants.
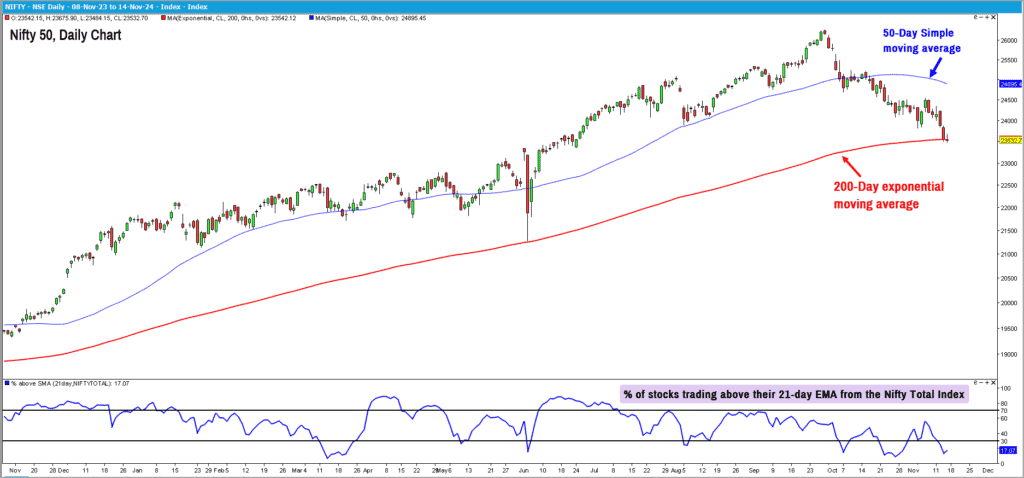
While we do not look at moving averages as potential support or resistance tool, we use them more as a trend delineation tool. The outlook for the Nifty 50 index is bearish and further slide cannot be ruled out.
But, a look at the breadth and the pace of the recent decline supports the case for a relief or a minor pull back in price. Most of the short-term breadth indicators including the percentage of stocks trading above the 21-day EMA are at deeply oversold levels. Even the PF-X% breadth indicator, that we have typically used in prior updates, is in the oversold zone.
In terms of price too, we are stretched from the moving averages, supporting the case for either a short-term consolidation or a sharp pull back. In the above chart, the percentage of stocks trading above their 21-day EMA from the Nifty Total Market (Nifty 750 stocks) is plotted in the lower pane. The indicator is oversold, and a positive divergence is also noticeable. This apart, while the Nifty 50 index made a fresh low, the breadth indicator has not done so.
That said, any pullback attempt in the index is likely to face resistance at 24,000-24,500 zone. A move above 25,000 is required to consider the possibility of a bigger upside potential. Until 25,000 is taken out, there is no point considering the chances of the index scaling to new all-time highs.
Therefore, for now, caution remains the buzzword for investors and fresh exposures are not recommended until there is clear signal of the bottoming out process. More importantly, wait for signs of broader markets displaying relative strength versus Nifty 50.
From a general index behaviour perspective, there are some interesting data points that can be gleaned from the study of the Nifty 50 price behaviour. We have already shared a few such data points in prior updates. There are two interesting data points which we wish to highlight here, which can bring some comfort for those worried about the current decline.
- Nifty 50 index tends to witness a 10% drawdown in almost every calendar year, and this has played out in 2024 as well.
- The PF-X% breadth indicator in 3% box size drops to an oversold zone in almost all calendar years save for 3 years in the past 25 years. The year 2023 was one such year where this breadth indicator did not drop to oversold zone. Any reading below 25% is considered oversold. PF-X% indicator captures the percentage of stocks that are in a bullish swing in a chosen box size. The PF-X% breadth indicator in 3% box size has dropped to the oversold zone now.
- A look at the Nifty 50 rolling returns over the 1,3 and 5 year period indicate that there is a strong case for the index delivering positive returns across all these time spectrums. Over a 5-year period, the rolling returns of Nifty 50 TRI has delivered average returns of 15.3% and almost negligible chance of a negative return. The maximum return was 47.2%.
To sum up, a look at these data points indicate that the Nifty 50 index has this tendency to deliver positive returns more often than not. And the longer the holding period, the higher chances of generating positive returns.
Sector indexes
Now, let’s move to two heavyweight sectors that have been displaying diverging behaviour – banking and IT.
Nifty Bank index
It may be recalled that this index was an underperformer versus the Nifty 50 index for the best part of the rally that commenced in April 2023. Interestingly, this index is displaying relative strength versus Nifty 50 in the past few weeks. The Nifty 50 index has fallen by 10.4% from the recent highs while the Nifty Bank index has lost 7.87%, suggesting relative outperformance for now.
The major swing low at 49,000 is the key level to focus. A breach of this level could impart downside momentum in the Nifty Bank index. A move past 52,700 would open further upside potential in this index. Keep an eye on 49,000 & 52,700 to ascertain the next trending move in the banking universe. If this index turns more bearish, it could translate into a deeper cut in the Nifty 50 index.
Nifty IT Index
This index has had an interesting behaviour in the past few years. The index turned an underperformer versus the Nifty 50 since December 2021 and remained so during the bull market witnessed since April 2023. The IT index then turned an outperformer since June 2024 and remains one of the stronger sectors during the recent carnage.
The Nifty IT Index is just 2.8% down from its all-time highs while the Nifty 50 index is down 10.4%. The technical outlook for this index is looks bullish too. A move past 43,100 would be a major sign of strength and could open up targets of 47,700-49,000. Keep an eye on this sector and look for investment opportunities as and when the Nifty 50 index shows signs of bottoming out. This index might turn out to be the leader in the next uptrend, whenever that happens. Only a close below 37,800 would make was reconsider the bullish stance for this index.
Here is the data capturing the extent of retracement from the 52-week high for NSE sectors and key indices.
It is apparent from the above data that the Nifty IT index is the table topper with the least damage in terms of fall from the 52-week highs. The Nifty Bank index is not too far away, occupying the fourth slot.
What is more interesting and glaring is the sharp underperformance of the erstwhile market favourites such as PSE, PSU Bank, Realty & defence sectors. It may be recalled that these sectors were the top performers during the recent bull run and have now turned rank underperformers in the past few months. These sectors are now relegated to the bottom of the heap with Nifty Defence index falling 27% from its recent peak.
To sum up, there is no reason to turn bullish or increase equity exposures in the current market environment. Sectors such as Nifty IT, Bank & Pharma are displaying relative strength. One may consider selective exposures in these sectors if and only if there are bottoming out signs in the Nifty 50 index.

Wait for the Nifty 50 index close above its 50-day moving average and when there is improvement in breadth in the broader markets. Also wait for the broader markets to display signs of outperformance before putting money to work. Based on the daily Point & Figure chart of the Nifty 50 index in 0.1% box size, there is a vertical count downside target of 22,200. As long the index does not cross above 25,000, there will be a strong case for a drop to this target.


7 thoughts on “Technical outlook: Is there relief in the short term for the Nifty 50?”
Thank you Krishnakumar for the update on Indices!
Any suggestion where to look for the breadth indicator of the Nifty 750 universe?
Hello:
I use the Definedge platform for my breadth studies. The web version of Definedge is called RZone which has facility to plot breadth indicators using a variety of metrics. There are other platforms too. But you will have to look around. I guess there should be free indicators available in Tradingview platform too. Or just google it and it might throw up quite a few other options.
Personally, I prefer the TradePoint desktop software and RZone web platform offered by Definedge.
Thanks
B.Krishnakumar
Hi, would it be fair to assume that when Nifty 50 may tread at around 22,200 that it may have bottomed out. And also that could be a point to fish for some opportunities in the IT space?
Hello Arun:
I would not suggest taking risk without any confirmation. The entire game is about stacking the odds in your favour. Just because the price reaches a level of your interest cannot be the sole reason to put your money at risk. Wait for the Nifty 50 index to close above its 50-day simple moving average. And, also keep track of the breadth indicator of the Nifty 750 universe. A simple and effective breadth indicator would be the percentage of stocks trading above their 20-day exponential moving average from the Nifty 750 universe. If this indicator crosses the 50% mark, it is a sign that there is buying interest creeping into the broader markets.
So, wait for the Nifty 50 index to cross the 50-day MA and also the breadth indicator of Nifty 750 universe to cross the 50% mark. If these two conditions are true, then it would be appropriate to take exposure in outperforming sector such as Nifty IT.
Until then, sit tight.
Hope this helps!
B.Krishnakumar
this is a very helpful takeaway besides the main article. always look forward to this technical analysis.
Thanks a lot for the feedback. Glad that you find the posts helpful.
Nifty pe ratio
Comments are closed.