The author is an external contributor. Views are personal and do not reflect the opinion and views of PrimeInvestor.
With the dawn of a new year, it is time to share the outlook for the year ahead. This time around, we do not want to take the usual route. Instead, we’d rather share a few data points which will provide a broad picture about what to expect in 2025. Before we get deeper into this data, let’s take a quick look at the short-term technical outlook for the index.
Nifty short-term outlook
In the previous update on Nifty 50 index levels, we had highlighted the 25,000-25,300 zone as a key resistance level and 23,600-23,800 as support zone for the Nifty 50 index. The price could not breakout above the upper end of this range and instead breached the lower level. This is a sign of weakness and indicates the scope for further downside.
Here is the daily chart of the Nifty 50 index.
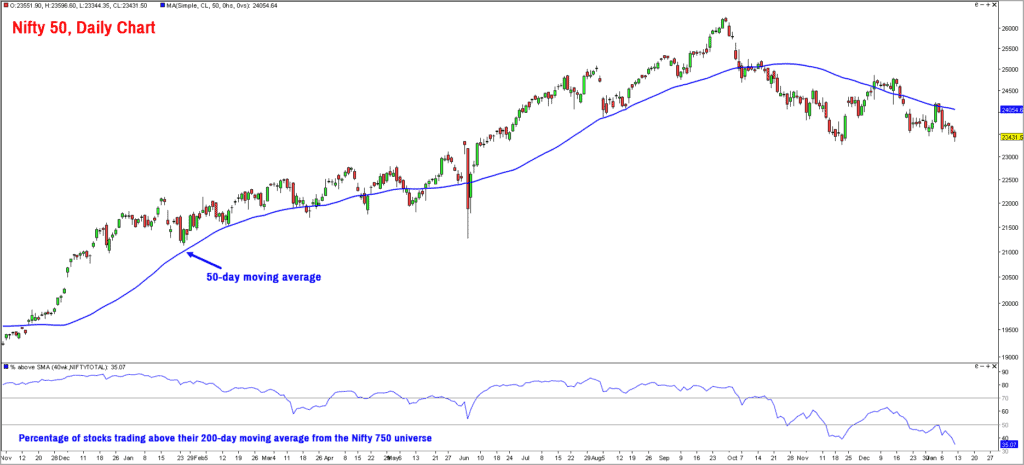
As highlighted in the chart above, the index is trading below its 50-day moving average which is a key sign of weakness from a short-term perspective. The index is also on the verge of breaching the prior swing low at 23,200. Once the index falls below this swing low, it would confirm a bearish sequence of lower highs and lower lows in a bigger time frame.
Now, let us move to the breadth indicator. The percentage of stocks trading above their 50-day moving average is captured in the lower pane of the chart displayed above. It is apparent that this indicator has struggled to even get past the 50% mark, suggesting that the recovery witnessed off the November 21 low was just a feeble attempt to stage a recovery.
A look at the breadth of the broader markets does not portray a bullish picture, either. The percentage of stocks trading above their 200-day moving average, from the Nifty 750 universe, has dropped below the 50% mark to 41%, suggesting that more than 50% of the stocks are trading below their 200-day moving average. In other words, majority of the stocks from the broader markets are in a bearish trend.
Have a look at the Point & Figure chart of the Nifty 50 index. Using vertical count method, a few downside targets are highlighted in the chart below.
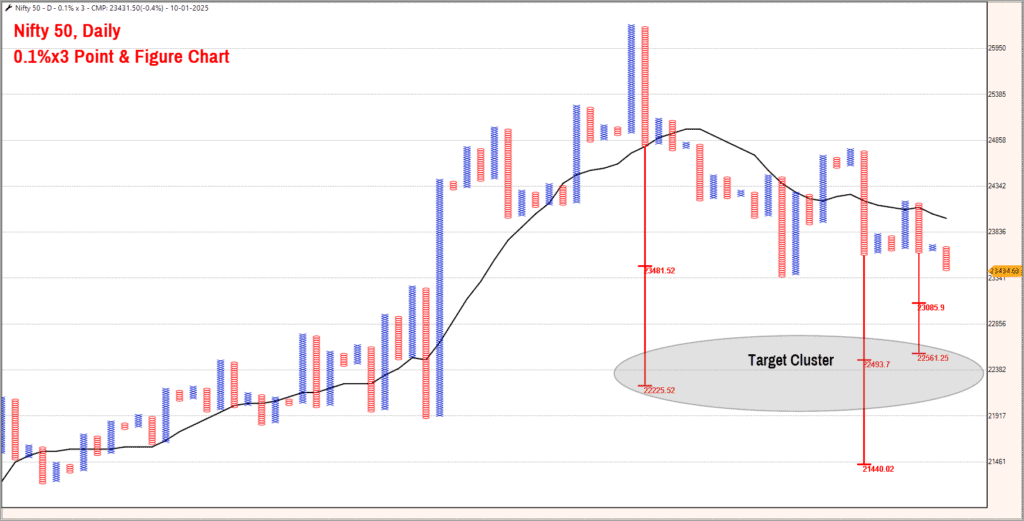
As highlighted in the chart, there is a target cluster at 22,200-22,600 range. A drop below the swing low at 23,200 would confirm that the index is headed to this target cluster zone. A drop to the next target of 21,400 is also not ruled out.
Unless the Nifty 50 index moves above the major swing high at 24,500, there would be a strong case for a slide to 22,200 and then to 21,400.
Sectoral indices
Before we wind up, let us take a quick look at a few sectoral indices.
Nifty Bank index
We had mentioned that a breach of 49,000 could be a sign of major weakness for this index. The Nifty Bank index is now trading below this level, confirming the onset of a bearish phase. More importantly, a near perfect bearish head & shoulder pattern has been completed in the Nifty Bank chart, confirming the possibility of further weakness.
The downside target based on the head & shoulder pattern works out to 45,500-46,000. Unless this index moves above 51,700, there is would be a strong case for a fall to 45,500-46,000.
What is even more worrying is that this index has resumed its relative underperformance versus the Nifty 50 index. After a brief period of outperformance, the Nifty Bank index has resumed its underperformance since early December.
Keep an eye on this index as the banking sector plays a big role in influencing the behaviour of the Nifty 50 index. Besides, banking sector is also a key barometer to assess the overall health of the economy.
Nifty IT Index
This is one of the bright spots in the markets now. This index is trading just 3.2% below its all-time highs whereas the Nifty 50 index is down close to 11% from its highs. This is clear sign of relative strength and outperformance.
As observed in the previous update, the short-term outlook for the IT index remains bullish and a rally to the next target zone of 47,500-49,000 appears likely. The bullish outlook would be under threat only if the IT index drops below the 41,000 level. This sector could be one of sectors to focus on in 2025.
Nifty MidSmallCap 400 Index
The short-term trend in this index too is not bullish. As highlighted in the prior update, this index has been performing at par with the Nifty 50 index. A fall below the major swing low at 18,700 would be a major sign of weakness and could push the index to lower levels of 16,000-16,200.
This index has also been displaying relative weakness against Nifty 50 index since early December, suggesting underperformance. Unless the index moves past 21,000, there is no point being bullish in the mid and small cap space. Also watch the relative performance chart of the index versus Nifty 50 to check if there is outperformance.
Do not consider increasing exposure to the broader markets until the price moves above 21,000 and there is a similar breakout and bullishness in the ratio chart or relative performance of this index versus Nifty 50.
The Nifty 50 in 2025
With that, let us move to the year ahead. As we said earlier, we will look at a few historical data points of the Nifty 50 index and map what to expect in 2025.
Nifty 50 data points
If you look at the calendar year returns for the Nifty 50 index since 1996, it is apparent that the Nifty 50 index delivers positive returns on a yearly basis in most years. Here is the chart capturing the calendar year returns of the index since 1996.
Highlights from the above are as follows:
- To be precise, the Nifty 50 index has delivered positive returns in 22 out of the last 29 years. This works out to 75.8% of the sample.
- The Nifty Total Returns Index has delivered annualized returns of around 14% since its inception in June 1999.
- And if one looks at the yearly drawdown of the Nifty 50 index since 1996, it is apparent that the index tends to witness a 10% pull back in almost every calendar year. The year 2023 was an exception wherein the drawdown or pullback from highs was at 7.2%, just a shade below the 10% mark. The Nifty 50 index witnessed a 10% drawdown in 2024 too.
Nifty 50 2025 outlook
With these data points in mind, here are the expectations for the year 2025:
- Expect a 10% pullback from the peak in 2025. This happens more often than not.
- Expect the Nifty 50 index to deliver positive returns by the end of 2025. The average return has been 15.6% and the median return is 12.02%.
Remember, these expectations are based on historical behavior, and we are dealing with probabilities here.
Our long-term study of the Nifty 50 chart suggests that the index could head to the next target of 30,200-30,500. But this is unlikely to be achieved in 2025. Until the price moves above 24,500, there is no point entertaining a bullish outlook. So keep a watch on that index level (and of course, we will be issuing our regular monthly updates on key index levels).
The other important indicator to focus on is the market breadth indicator. Track the percentage of stocks trading above their 200-day moving average from the Nifty 750 universe. Unless this indicator scales above the 50% mark, there is limited merit in looking for buying opportunities, especially in the small and midcap space.


8 thoughts on “Technical outlook: How 2025 can shape up for the Nifty 50”
Pl give rough targets for Nifty Midcap and Small, esp after the slaughter on the weekly close on 14th Feb
Hello:
Our next update will cover the downside targets for Nifty, Midcap and Smallcap indices. Please wait for a day or two.
B.Krishnakumar
Thanks for sharing the analysis sir. This is very useful
Thanks for the helpful write up! Pointers on the below may help:
1. Will Nifty 50 levels like 22.6K or 2.14K be opportune for some bottom fishing?
2. Consumption as a theme is something that I bet on; any thots on this sector?
3. Thots on Gold for the year ahead.
Appreciate your inputs on these. Thanks.
Hello:
Here is my brief reply on your queries:
1. Too early to conclude if 21.4l or 22.6K would be opportune moment to buy. What if the price slips even further or what if the price does not reach those targets and reverses from a much higher level? The point am trying to convey is that we need to evaluate as price action unfolds. We are working with a hypothesis here and the price action would confirm or invalidate it. Based on that we need to formulate our strategy.
As mentioned in the post, let us wait for the index to turn bullish and also the breadth to improve for the Nifty 50 index and the broader markets. Until then there is no point speculating on when and where to buy.
2. Consumption / FMCG looks just okay, nothing great. Remember, when Nifty falls, not too many sectors would manage to deliver positive returns. We can probably get away with a lesser damage in defensive sectors such as consumption of FMCG. You can also consider investment in Non Cyclical Consumer Index which could be a better choice. This index has displayed relative outperformance since November 14.
3. Gold is bullish and my target for Comex Gold is around $3,050-$3,100 per troy ounce. This is gold futures price traded at Comex.
Hope this helps!
B.Krishnakumar
There is a gap between 20300 and 20500 in nifty weekly/monthly charts. Will this gap be filled?
Hello:
Gaps often act as support or resistance and they often get filled. But there is no compulsion for all gaps to be filled. Unfilled gaps are often considered as a sign of strength or weakness, depending upon the direction of the gap.
Let us look at several steps ahead. I would rather prefer to stay in the current and tread one step at a time. As always, we will keep you updated as and when we suspect a significant change in our outlook.
Regards
B.Krishnakumar
Hello:
Gaps often act as support or resistance and they often get filled. But there is no compulsion for all gaps to be filled. Unfilled gaps are often considered as a sign of strength or weakness, depending upon the direction of the gap.
Let us not look at several steps ahead. I would rather prefer to stay in the current and tread one step at a time. As always, we will keep you updated as and when we suspect a significant change in our outlook.
Regards
B.Krishnakumar
Comments are closed.