When it comes to investing, more than half your success lies in proper asset allocation. This is why, time and again, we have reiterated the need to have the right mix. For most of you, the lure of high returns in equities often leads to loading up on the asset class, oblivious to its risks, especially when your goal is short to medium term. This is why we did a series of articles on what should be your asset allocation under various scenarios and summarised our findings based on historical data. These articles written by Aarati Krishnan and published in recent months are given below:
- A 100% equity portfolio: Will it work? – PrimeInvestor
- 70/30, 60/40 or 50/50: Which is the best asset allocation? – PrimeInvestor
- What asset allocation best fits 10-year, 5-year and 3-year goals? – PrimeInvestor
- How much should you allocate to gold? – PrimeInvestor
In this article, we are now sharing the source data and tool for all the above analysis. We are sharing a comprehensive Do-it-yourself (DIY) tool through excel sheets, further enhanced (since the above articles) to perform your own customised asset allocation analysis and check the findings for yourself.

About the source data
The tool uses the Nifty 100 index values to represent equity performance. For gold, we use its price in Rupees. Due to the unavailability of a comprehensive debt index covering the required period, we have used the NAV of the SBI Magnum Gilt Fund (Growth Plan) as a proxy for debt.
This analysis spans more than 21 years, from January 1, 2003, to May 14, 2024. The excel download is given below.
Inputs for the asset allocation analysis tool
This section will explain how to use various sections of the tool.
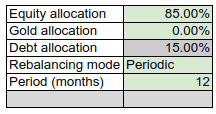
#1 Asset allocation
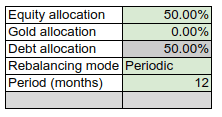
In the top-left section of the tool, you can enter your desired allocations for Equity and Gold. The Debt allocation will be automatically calculated based on the remaining percentage. Ensure that the combined total of Equity and Gold allocations does not exceed 100%. If the sum exceeds 100%, the values will be ignored.
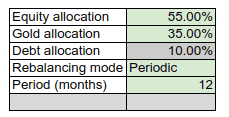
#2 Rebalancing

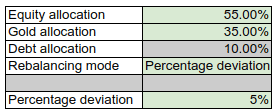
Here you can set the rebalancing mode to one of the following: Periodic, Percentage deviation, and Hybrid.
- Periodic Rebalancing: Enter the period in months. The portfolio will be rebalanced at these specified intervals.
- Percentage Deviation Rebalancing: The portfolio will be rebalanced only if any asset class deviates from its target allocation by a specified percentage. For example, if your initial allocation is 55% Equity, 35% Gold, and 10% Debt. A significant market movement might change your allocation to 60% Equity, 31% Gold, and 9% Debt. Since the equity allocation has deviated by 5% from the original, a rebalance will be triggered.
- Hybrid Rebalancing:The portfolio will be rebalanced both periodically and when a percentage deviation occurs.
#3 Baseline returns
Often, it’s useful to compare your portfolio’s performance against a baseline return to see if it meets your expectations. For instance, you might want to check if your portfolio consistently achieved at least a 6% return over any 3-year period to assess its performance relative to inflation.

#4 Point to Point returns
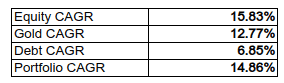
This section displays the point-to-point returns for the entire period from January 1, 2003, to May 14, 2024, for each asset class. It also shows the returns for the portfolio based on your desired asset allocation and selected rebalancing mode. In the later part of the excel, you will be given an option to change these values, based on your expectation. More on this in the section (further below) – ‘Advanced Inputs’.
What the asset allocation tool shows
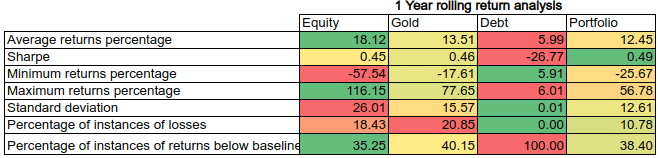
In this section, the portfolio and the three asset classes will be analysed across various metrics. The analysis will be conducted for four different rolling return periods: 1 Year, 3 Years, 5 Years, and 10 Years.
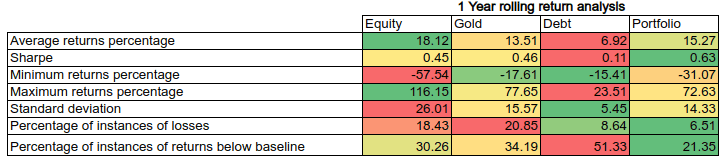
The metrics:
- Average returns percentage: Average returns for the asset class/portfolio. In the above example, average 1-year returns of the portfolio is 15.27%
- Sharpe: A measure of risk-adjusted returns. It evaluates returns generated over a risk-free rate, adjusted for volatility. The higher the Sharpe ratio, the better.
- Minimum returns percentage: The lowest return or the worst observed in the period. In the above example, Equity has seen a lowest 1-year return of -57.54%
- Maximum returns percentage: The highest return observed. In the above example, Gold has seen a higher 1-year return of 77.65%
- Standard deviation: A measure of volatility. The lower the Standard deviation, the better.
- Percentage of instances of losses: The percentage of times the returns were negative. Assume there are 1000 instances of 1-year returns in the observation and 200 of them are negative. In this case, the percentage of instances of losses is 20%. The lower, this is, the better.
- Percentage of instances of returns below baseline: The percentage of times the returns fell below a given baseline return. For example, If you set a 10% baseline return and observe that returns fell below 10% in 30% of the instances, this percentage is 30%. The lower, the better.
Advanced inputs
The analysis is based on historical data, but you can make adjustments to test specific scenarios in the Advanced section, located at the bottom of the sheet after the rolling return analysis. However, when you do this, please make sure your return expectations are realistic
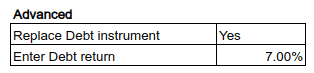
Customizing Debt Returns
You can change the debt index to a fixed return rate. For example, if you want to see how the portfolio would perform if the debt component had a stable 7% return, select “Yes” in the “Replace Debt Instrument” field and enter a 7% return. You can set the debt return to any value between 2% and 10%.
Adjusting Equity and Gold Returns
You can also adjust the returns for Equity and Gold to see how these changes would impact performance. Instead of replacing the indices, you can apply an additional return to either or both:
- Equity Returns: Increase or decrease returns by up to ±6%. For instance, if you want to see the impact of equity returns being 1 percentage points higher, you can adjust this in the section.

- Gold Returns: Similarly, you can increase or decrease returns by up to ±6%. For example, if you want to see the effect of gold returns being 2 percentage points lower, you can configure this setting accordingly.

Do note that the volatility of modified Equity, and Gold index values will be similar to the original indices.
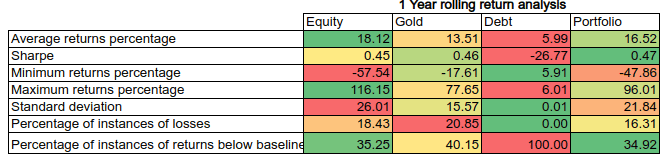
Let us take an example of finding Optimal Debt Allocation to Minimise Portfolio Returns Below 8%.
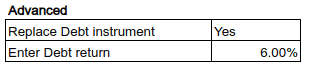
Let’s say we want to determine the optimal allocation of a 6% yielding debt to minimise the instances of 1-year portfolio returns falling below 8%.
1.Adjusting Debt Instrument: In the Advanced section, select “Yes” to Replace Debt Instrument. Set the debt return as 6%.
2. Setting Baseline Returns: Set the baseline returns as 8% (illustrative number).

3. Analysis:
- With a 100% equity portfolio, 1-year returns fall below 8% 35.25% of the time.
- A 50% Equity and 50% Debt portfolio experiences this 38.4% of the time.
4. Optimization:
- Experiment with different equity allocations to observe changes in the percentage of instances of returns below the baseline.
- At around 85% equity allocation, the percentage of instances of returns below 8% is minimised.
Warning: Considerations and Limitations
Please note that the tool does not account for tax implications. In practical scenarios, manual rebalancing or changes in investment vehicles may trigger tax events. For instance, switching between funds, especially active mutual funds is a likely scenario over a long period. This may result in capital gains and tax obligations.
Conclusion
It’s crucial to remember that past performance does not ensure future results. While this tool will give you insights, it’s essential to use it for general guidance rather than making precise plans.
Be mindful of any adjustments made in the advanced section, as they can significantly impact the analysis.
Disclaimer: This tool is not advisory in nature and is meant to equip you with calculations and analysis for various asset allocation scenarios. The final decision of asset allocation must be based on your risk profile, age, income and goal, among many other factors. Consult a financial planner before making investment decisions if you are new to investing or have not devoted the time necessary to understand equity and debt markets.


14 thoughts on “Do your own asset allocation analysis with this unique excel tool! ”
Hi Bipin,
I am a CA and was looking for some handy tools for portfolio analysis. I just saw this Article and must really appreciate your efforts in creating a really very useful tool for those investors who would like to do their own analysis and research supplemented by external sources like your website. Please keep it up.
Going through the other feedback and also my experience, I would like to suggest the following:
a) To maintain the effectiveness of the tool in future, one needs to constantly update the source data. But this will require the user to know how exactly the source data need to be updated to get latest insights. It will help if you can please guide on same.
b) Also I believe any tool is more useful if one can understand the logic inbuilt therein. Is it possible to have an online session (or at least a pre-recorded video) which can walk us through the tool and guide us through the logic behind the different sheets?
Looking forward for your response
Regards
Amit
Hello Sir,
Glad to hear that you find it useful
Regarding updating the source data: I understand that this is relevant, especially as time passes. The reason I didn’t give an instruction to do this is because a single blank cell while replacing the data may cause the whole sheet to malfunction.
We have noted down your feedback and would consider giving instructions on how to replace the data in the future.
Regarding the logic: it simply allocates initial amount at the asset allocation set across the 3 asset classes and then performs various sells and buys depending on the rebalancing criteria set in the tool.
I understand that the use case with sample analysis could be useful, we will try to include this when we revisit this project.
Thanks
Hi, Great one for adjusting or exploring to balancing the assets. May I ask, there were many articles on Balanced Adv Funds for SWP in the ready made portfolios (3-5/5+ years horizon). Is that approach re-validated now? Since I see only Floating rate Funds have been recommended for SWP not BAF/Multi Asset Funds. Thanks Siva
Thanks!
About BAF for SWP: I assume SWP is seen mostly in the context of retirement portfolios. On one hand, for those who do not want to worry about managing asset allocation, doing rebalancing, etc; SWP from BAF will provide a ready-made solution; although it will need a deeper analysis to see how this strategy could have worked for various combinations of duration for retirement income and risk appetite.
On the other hand, a key point of retirement portfolio management is to decrease the probability of redeeming from equity at the time of unfavourable market conditions and this is better done with separate debt and equity allocations. For example, if equity has seen a correction, the BAF fund manager might have increased the equity allocation to buy equity at lower valuations, however, if the SWP is done from BAF at this point, the investor will be essentially selling more equity at lower valuations.
Hello Bipin
This is a fantastic tool. I really loved it. It gives some important data points like the Sharp ratio, Standard Deviation, Max & Min returns for 1 , 4 5, 10 year rolling basis. It gives a clear picture about the stability of the portfolio and comfort about returns in the long period and helps in staying put through the volatility. Till now I never had such nice prognosis Please keep sharing such information and tools for DIY. Thanks
Thank you!
I apologize, sir, but this is beyond our comprehension.
We are not analyst.
We are investors.
And that’s why we have subscribed.
I apologize again sir but kindly make the necessary changes so that we can benefit from your wisdom, experience and diligence.
Regards
Hello Sir,
Apologies. We have published the findings from this analysis earlier through a series of articles, which are referenced at the beginning of this article. In this article, we are sharing the tool so that anyone interested in further analysis can use it. If you wish to check the behavior of any specific asset-allocated portfolio and are unable to do so with the sheet, kindly let me know, and I’ll get back to you on that.
Thanks
Sorry to say this, the sheet is so much confusing and too complicated to use. Couldn’t understand after multiple reads what needs to be done and what i am going to achieve? The portfolio rebalancing calculator on the site is much easier to use it than this sheet… For me to rebalance i can use the calculator to check how much it had deviated from my setup allocation and can do the rebalance. I couldn’t understand what additional use of this excel sheet will provide me other than the showing historical data of which asset class had given how much % Returns.
Thanks for the feedback. Will keep this in mind while working on similar things in the future.
About where this spreadsheet tool stands compared to other tools in PrimeInvestor:
If you have decided on a specific asset allocation, the Portfolio Rebalancing Calculator will help you to bring the asset allocation back to the intended asset allocation, if deviated by a certain percentage.
If you want to go with our recommended asset allocation, you can use Build your own portfolio
If you want to find the asset allocation by yourself, by looking at the various return and risk metrics for different asset allocations based on historical data, you may use the spreadsheet tool provided in this article.
For example, it can be used to compare how a 60% Equity, 30% Debt, 10% Gold portfolio performed against a 50% Equity, 30% Debt, 20% Gold portfolio on both risk and return metrics.
excel link is not working
Please check from the link here
Dear Bipin,
Unfortunately the link in your reply isn’t working either. Tried in from the primeinvestor app, but the same issue. Throws error “403 Forbidden” nginx. Any other way we can download it elsewhere?
Sorry that it didn’t work for you. We aren’t able to replicate the issue at our end. If this is still not working for you, please write to us here https://www.primeinvestor.in/contact-us/ and we’ll provide you the file.
Thanks.
Comments are closed.