If you were told that the biggest risk to your portfolio is the market risk (mutual funds are subject to market risk), we have a different take. There is an even bigger risk to your wealth-building journey – and that is the risk of wrong return expectation.
“We deceive ourselves when we believe that past stock market return patterns provide the bounds by which we can predict the future” .
John Bogle

Let me explain with a simple illustration. Let’s say you started investing 10 years ago, say in early-to-mid-2013 and saw that the markets easily returned 20% in a decade then. You start investing Rs 20,000 in May 2013, when the previous decade’s return was 20%. You took the right advice of looking only at long-term returns. With that return in mind, you hoped to reach Rs 75 lakh in 10 years for your child’s education abroad. More, you did not start at a market peak. In fact, the Nifty 50 trebled since.
But what was your corpus 10 years later in May 2023? Rs 43 lakh! That’s a 43% deficit to your goal. This is how expected return deceives you!
- High return expectation makes you focus on the market rather than on your savings and investing behavior. In other words, it compels you to focus on what you have no control over.
- High return expectation on your core portfolio not only makes you fall short of your goal but also pushes you into rash acts of losing money as you try to make it up in other ways (crypto or commodity trading for instance). In other words, high return expectation pushes you to take higher risks than warranted once you see you may not reach your goal.
- High return expectations may push you into compromising on life goals or requiring you to work longer than you wished.
High return expectations and reality
Before we get into why you cannot afford to be overconfident about a return bounty, check the data below. The lucrative PPF that was used by our parents/grandparents has steadily declined. In fact, it delivered as much as what equity delivered now. Why did it decline? The government has more sources to raise money from than being dependent on us, the retail investors.
The 10-year government security yield has steadily declined over the past 2 decades. There is more money chasing the attractive India bonds now, thus increasing the price of these bonds and reducing their yields. There are other macro reasons of course but suffice to know that this is the trend.
The Nifty 50’s 10-year rolling returns graph below will tell you that the Nifty 50 has never touched the annualized-20%-in-a-decade-returns after 2013. While Covid did impact the last decade’s return, even without that, the graph will tell you that returns have been moderating.
In fact, had you invested in any 10-year bucket after March 2009 (see chart for returns after March 2019) you would never have managed even a 15% annualized return in the market!

Call it a high base, call it declining ROE of companies and therefore lower returns, call it less information asymmetry, call it too much money chasing too few stocks, call it too much of ‘active’ fund management or simply that the Indian market is maturing – the fact is that decadal returns have been moderating. Yes, you probably managed 15% in 15 years but even that has only been declining from far higher returns earlier.
You might argue that you could still hit it with stocks. Perhaps true, but please remember, even there, you would hold a portfolio of stocks, not an individual stock. The 20% returns in Reliance Industries in the last 10 years would have been normalized by the 12.5% return in TCS or the almost-flat performance in Lupin (4% annualized in 10 years). It’s very hard to make an entire portfolio outperform (as fund managers might tell you😊)
So, unless you are an ace investor (referring to users of Prime Stocks and Prime Funds 😊), the chance of your portfolio returns outperforming the Nifty is slim. Even if you take the Nifty 500, the average 10-year return over its lifetime is just a percentage point more than the Nifty 50 (perhaps marginally higher with mid-and-smallcaps). And you all now know that the margin of outperformance of fund managers (over the index) too has been coming down or there is underperformance in several funds.
Now let’s come back to return expectation. Here’s the final reality check. The data below gives you the breakup of the Nifty 10-year rolling returns graph given earlier (above) in terms of range of returns. While your chances of earning over 12% are reasonably high at 51% overall, do note that the graph earlier shows that that chance of 15% returns has simply not come by after 2019. That leaves the 12% and odd bucket a more current trend.
What is a realistic return expectation?
Unfortunately, a realistic return is a moving target. It changes with changing macro-economic trends, changing interest rates, global growth as well as the composition of the stock market itself (nature of sectors that participate in the stock market). With these constraints let us look at some simplified (for the sake of determining a ballpark return expectation) ways to make an estimate.
#1 Nominal GDP Growth
You would have heard some big fund managers talk of market returns largely tracking the economic growth over the medium to long term. So let us take blocks of 5 years to see the annualized GDP growth (data on GDP taken from RBI statistics).
When the GDP growth is calculated in terms of current market prices (and not adjusted down for inflation) it is called nominal GDP growth or GDP growth at current price. For this purpose we took GDP at market price (which adds taxes and reduces subsidies from GDP at factor cost) at current prices.
We took periods of 5 years since the changes in the economy in a block of 10 years are way too many. We compared the Nifty 50 average rolling 5-year returns for such periods with the GDP 5-year growth. The graph below has data that can be downloaded.
DO NOT try to make a direct correlation between the GDP growth and Nifty returns. They do not always correlate well as there are lags and leads (the overall correlation is in fact low). What you need to know is the following:
- The nominal GDP growth over the blocks of 5 years we have taken above (period taken as far as Nifty 50 rolling 5-year return was available) came to 12.7% annualized return whereas it was 11.4% for the Nifty 50. The Nifty enjoys outsized gains but also suffers from sharp falls. Hence, the averages seem lower.
- The Nifty 50 underperformed the nominal GDP growth 57% of the time. The average underperformance was 1.3%. This should not shock you for multiple reasons: one there is a far larger universe of companies in the economy than what is represented by the equity market. Two, as my colleague NV Chandrachoodamani observes, the composition of the Nifty is either dominated by companies whose ROE has fallen over the years (finance) or whose fortunes are increasingly linked to global factors (oil and energy) or global growth (tech companies), or where growth prospects are limited (staples). So, a change in fortune in the above aspects will be necessary to match or overtake the nominal GDP growth.
- Forget the Nifty 50 returns. The data below might appear to suggest that the nominal GDP growth itself has moderated in blocks of 5 years in recent decades. The bar graph below shows that post 2010, the nominal GDP 5-year growth has been moderating even if you ignore the Covid-hit blocks of years.
The above data points provide the following rough inferences:
- Do not expect market returns to be higher than nominal GDP growth. This can change if more high growth companies get listed and join the Nifty 500 (which is when it may become an investible stock in most cases for fund managers).
- The average of the 5-year nominal GDP growth since March-2013 is about 11.6%. Giving room for Covid years, 12-13% seems more realistic to expect, if you have a very good portfolio that is! Please note that this is not our estimate. We are merely going by the average trends.
#2 Equity risk premium
While the nominal GDP growth might provide some clue on the return direction, in the stock market, you can never escape the risk of time. Even with a 10-year time frame, the risk reduces but does not go away. This is why moderating your return expectation based on Equity Risk Premium becomes important. Simply put, equity risk premium is the excess returns you expect over a risk-free rate of return.
We have covered this in detail in this article: Risk premium and how to use it. Calculating risk premium is a complex task and most of us are not qualified to come up with one – with confidence 😊 However, a paper put out by RBI in 2020 gives an idea of the same.
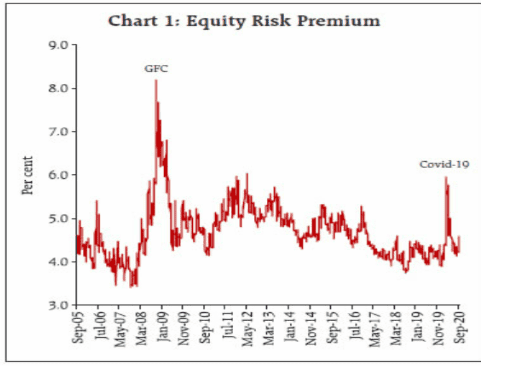
The excerpt above from the RBI paper suggests that India has had a 4.5-6% risk premium range on an average. But that is not what I am trying to highlight. What is more important is the inference:
- Equity risk premium or the returns you can expect from a risk-free rate goes down in a bull market. When markets have rallied, ERP reduces simply because the growth potential reduces.
- When markets correct ERP peaks as you can see from the global crisis and Covid year. In other words, that means when risk aversion is high, investors seek depressed prices to invest in the same asset now, for it to deliver.
While the above data might suggest a 4.5-6% risk premium on an average, when you invest in bull markets, you necessarily need to reduce your risk premium and up it when markets correct. For example, with a rallying market now (and the 10-year risk free rate at about 7.2%), your ERP could well be limited to 4-4.5%. That leads us to a similar return expectation (of 12-13%) we arrived at with the GDP growth.

Debt return expectation
While this article is largely to address your return expectation in equity, many investors actually forget that there is a debt component in their portfolio. Whether it is provident fund or deposits or debt funds, it may well account for 20-40% of your portfolio. A silly mistake as it may seem, many investors directly assume their equity return expectation to be their portfolio return expectation, forgetting that even a 20% exposure in debt will temper the returns (just as it will temper effect of equity falls). So, let’s have a very quick look at debt return expectations.
When it comes to fixed income, past RBI Governor Raghuram Rajan in 2016 said that he wanted real returns of 1.5-2 percentage points for savers. Real return is the return adjusting for price rise (inflation) in the economy. He wanted the RBI to monitor and keep inflation under check and protect savers. We do think the RBI has largely been keeping inflation (CPI) under check. Let us look at the data for this – again in blocks of 5 years.
If we seek to simply beat inflation with a similar target, then 1.5-2 percent higher than the average of 5.2% (for above blocks of 5 years), then a 6.5-7% seems likely. This is where the 5-year and 10-year bond yields are at, presently. Unfortunately, tax plays huge havoc in this return process. To this extent, some exposure to bonds with high risk (there is Prime Bonds for you) and higher yield may become inevitable if your return expectation is any higher.
Conclusion
The data we saw in equity clearly alerts you to moderating your return expectations on your portfolio if it was otherwise. Please note that the above equity returns expectations we discussed do not hold good for individual stocks. You might still hit multibaggers (or at least high returning ones from Prime Stocks! 😊). And needless to say, some component of midcap and smallcap will help, although recent trends suggest that even an index like the Nifty Smallcap 100 has struggled to beat the Nifty 50 over rolling 5-year return periods, as the drawdowns in the small cap space makes the climb back even harder.
Strategy-wise, some exposure to stocks (with professional research/advice) and higher yielding bonds would become a need for those who wish to keep their return expectation above market averages. Behaviorally, the best way to overcome these limitations is to save more rather than keeping return expectation high. Anything you get more than what you expected is a bonus – for disciplined investing rather than taking risks!


12 thoughts on “Why your return expectation may be wrong – And how to set it right”
Dear Vidya
As usual, a well researched article, also well articulated. This is the quality we have come to expect from you.
How come you missed out quoting the late Charlie Munger “The first rule of a happy life is low expectations. If you have unrealistic expectations you’re going to be miserable your whole life. You want to have reasonable expectations and take life’s results good and bad as they happen with a certain amount of stoicism.” 😀
Something similar was echoed in the recent ppfas unit holders meet. incidentally PI charts were used to drive the return expectation points.
This is not even golddust , this article is a glittering diamond to be saved , savoured and most importantly to be understood (and implemented) in entirety. Thank you 🙂
Thanks a lot! 🙏 😊
Very comprehensive coverage of the topic.
Some years ago, during a webinar you had discussed this topic. However, the present article is really comprehensive. My sincere thanks.
Many thanks! 🙏
good one Vidya…very relevant in this hyper run up markets
Thank you sir! 🙏 Vidya
If nominal GDP is likely to have a ceiling of 12-13%, a Nifty 50 or large cap centric portfolio will likely have lower returns than this range (10-11% max), based on what’s written in the article. Is this understanding correct?
That’s the middle scenario yes, a best case scenario can be that it matches or surpasses the nominal GDP. thanks, Vidya
Good informative article. Thanks Vidya.
Thank you sir!
Comments are closed.