A couple of months ago, we had given an outlook for the Nifty 50. Today, we’re giving an update to that Nifty 50 outlook. Here is an extract from the previous update:
“…. This indicates that the index is getting ready for a corrective or a cool-off phase. This cool-off in breadth could play out either as a price correction where Nifty 50 could drop to lower levels or as a time correction where the price consolidates in a range. We could see a spike in volatility if a time correction were to play out.”
The time correction mentioned in the previous post played out and this phase was marked by a spike in volatility. So, let us do a status check on the current situation.
As always, let us begin with the bigger time frame by observing the Nifty 50 chart in the 3% brick size Renko chart format. Here is the chart.
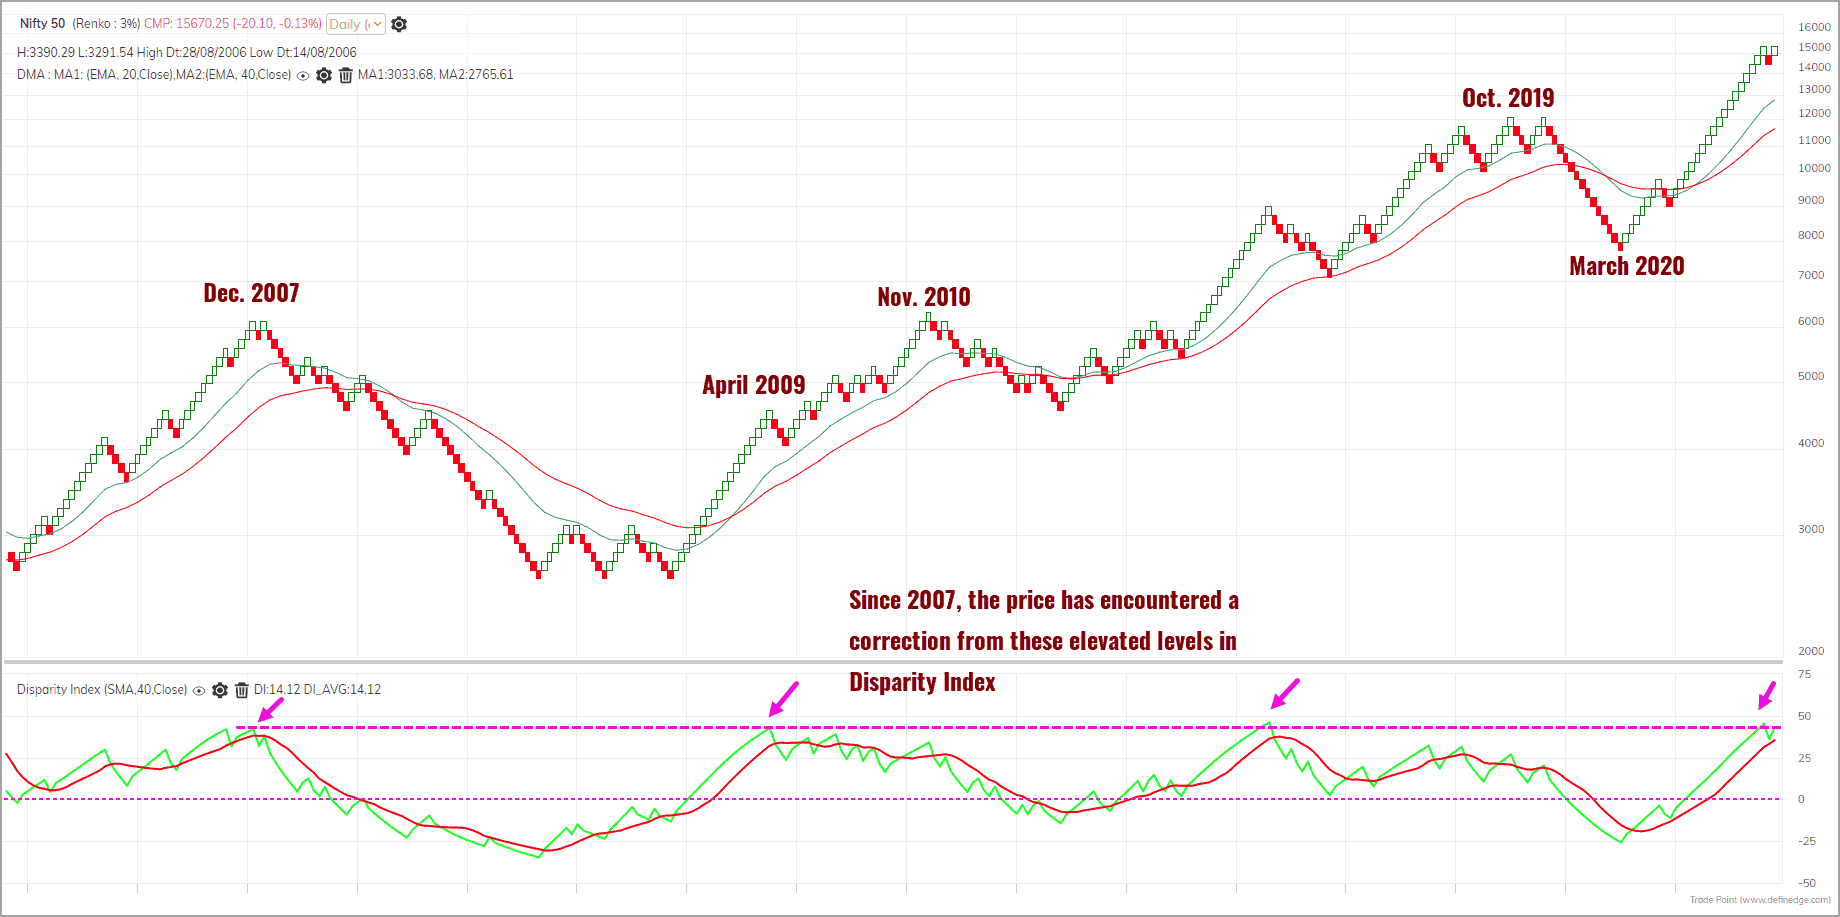
As highlighted in the above chart, the Nifty 50 index has moved into a corrective phase when the Disparity Index (this measures the distance between the price and the moving average in percentage terms) has been at the elevated or overbought level of around 45%. Though the Disparity Index has subsided slightly due to the recent cool off in the index, it is still near overbought levels. This essentially means the threat of either a timewise or a price correction is not eliminated. But let us discuss two possibilities here.

Bullish Case Scenario
The recent price action is bullish with the Nifty 50 recording fresh all-time highs. The Disparity Index in the short-term time frame has cooled off a lot and is accommodative of a short-term bounce. This bullish case scenario can play out provided the overbought Disparity Index reading in the higher time frame (3% brick size in Renko) is resolved by a spike in momentum.
This would help let the Nifty 50 index march higher even as the Disparity Index stays in the vicinity of the overbought zone; i.e, the significance of Disparity Index as a factor would reduce a tad. If you look at the above chart, this scenario played out during June 2009 to November 2010. The deeper correction leading to a cool off in the Disparity Index happened after November 2010 high.
This is the best-case scenario that can be visualised. And the following short-term Point & Figure chart of the Nifty 50 index seems to be supportive of this bullish scenario.
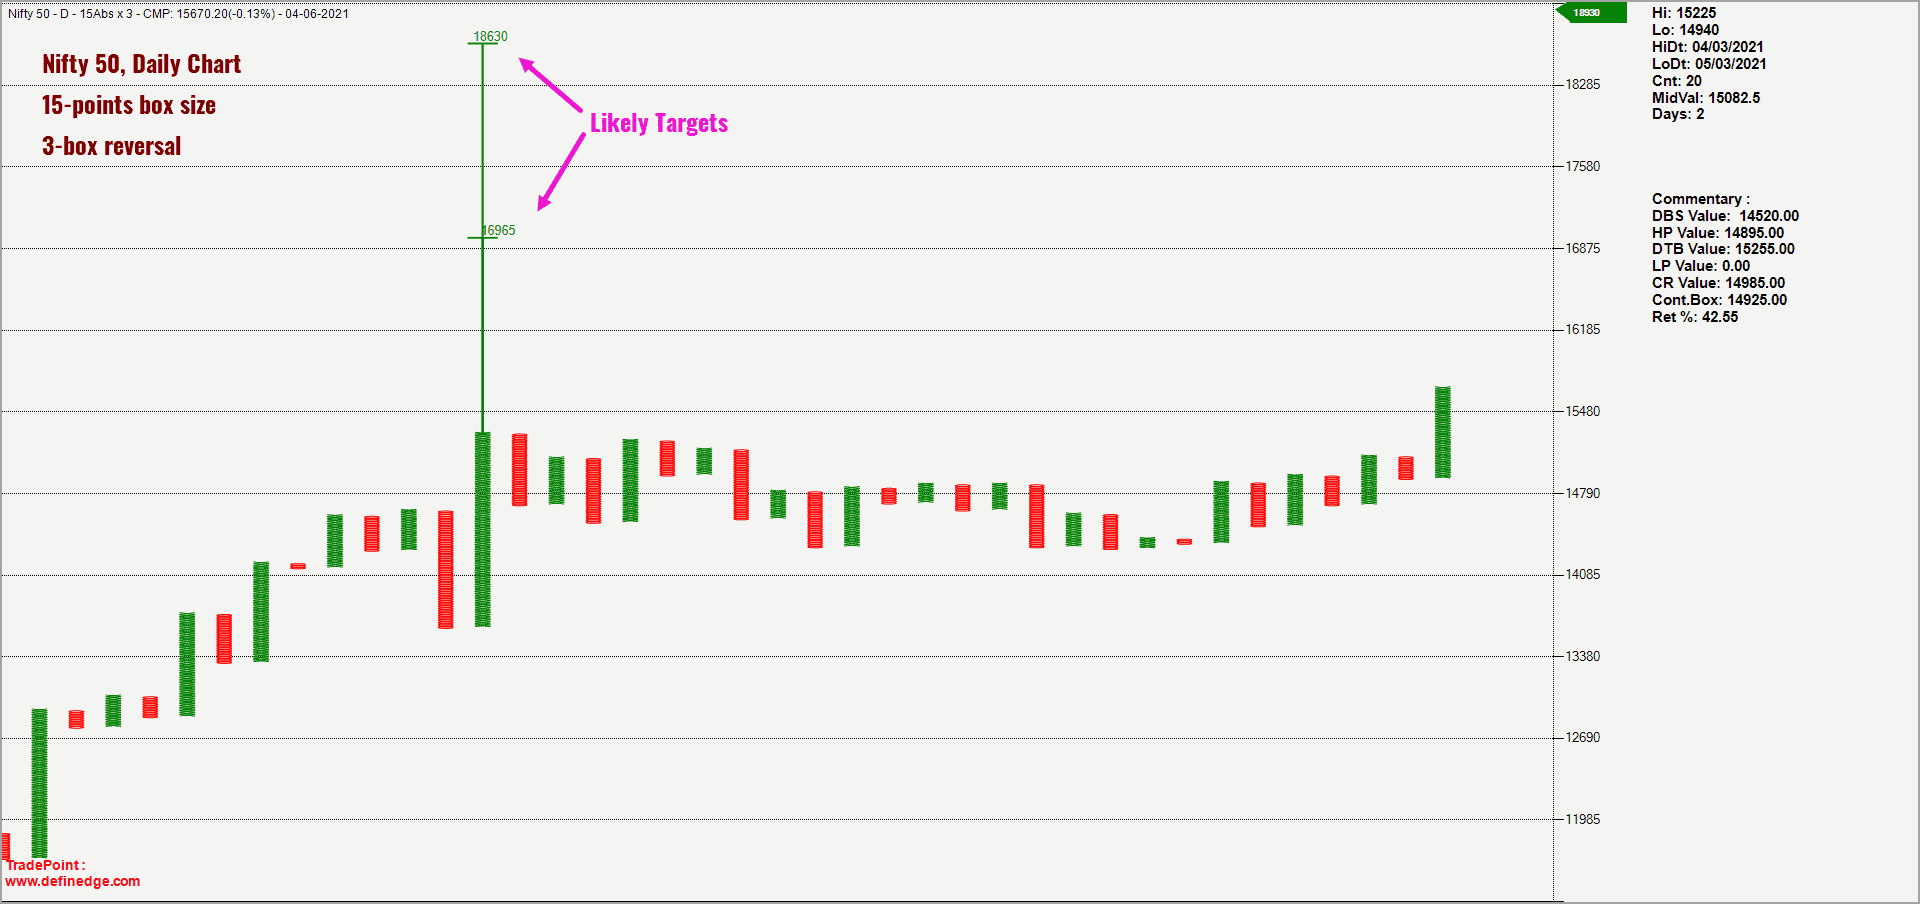
There are two targets plotted in the above chart using the Vertical Count method in the Point & Figure charts. The targets are 16,695 and 18,630. These targets would be invalidated only if the Nifty 50 index closes below 13,600.
Until this swing low at 13,600 breaks, there will be a case for a rally to the targets mentioned above. As observed earlier, this is the best-case scenario and this looks like a probable scenario as well, based on the current market structure.
Let us take a quick look at the top 10 heavyweights of the Nifty 50 index. These top 10 stocks account for about 59% weightage in the Nifty 50 index. Out of these 10 stocks, the top three – namely, Reliance Industries, HDFC Bank and Infosys – account for about 28% weightage in the index.
The short-term technical outlook for Reliance Industries and Infosys looks positive. Based on the short-term targets for these stocks, there appears to be a potential for 5-8% appreciation in these. To some extent, this lends strength to the short-term bullish case scenario. Let us not forget that these stocks can move up but if others do not participate, the Nifty 50 index can still struggle or even slide to lower levels.
The outlook for the private bank heavyweights such as ICICI Bank, Kotak Bank and Axis Bank looks promising too. If these stocks begin to accelerate, the Nifty 50 index could comfortably head towards its target.
Alternate Scenario
Let us look at the alternate scenario as well. In this scenario, the premise is that the index is still vulnerable to a downward corrective phase. The Disparity index in the 3% Renko chart (featured earlier) is the primary factor supporting this view. There are a couple of other breadth indicators that are at the overbought zone.
As this is not the preferred scenario, let us not delve deep into this possibility. This alternate scenario will come into play if the Nifty 50 index slides below 14,100. While a few may consider that this invalidation level is too far away from the prevailing index level, there is no better alternative for now.
We will have to wait for further price action to unfold to arrive at a better or higher invalidation level. For now, we have to live with 14,100. We will share an update if there is any change to our base case bullish scenario.

Here are a few suggestions to deal with the scenario
- Stay with your equity allocation. Stick to quality names and as always have a clearly defined exit plan for your holdings.
- While the preferred outlook is Nifty 50 seeking higher levels, it is pertinent to note that the mid and small cap stocks represented by the Nifty MidSmall400 Index is still outperforming the Nifty 50 index.
- Consult your financial advisor and diversify into quality mid or small-cap-oriented funds.
- I cannot emphasise this enough – have a clearly defined exit plan for your existing equity holdings and stick to it.
- Your regular SIPs need not be influenced by the observations made in this post.
Based on how the price unfolds, we will come up with an update if we sense a threat to the base case scenario.


18 thoughts on “Technical outlook: Where’s the Nifty 50 headed?”
Please note I am referring to exit plan for stock not MF
Hello:
I can talk about a few simple exit ideas from a technical analysis perspective. I am not sure how to draw a parallel for investments made on fundamental analysis. Here are some simple approaches that you may consider:
1. Simplest of the lot is to exit your stocks when the price closes below some chosen moving average. Typically,a 200-day moving average (DMA) would be a good place to start. So, you may choose to exit when the stock you hold closes below its 200-DMA.
2. You can add more layers of complexity based on how early or late you wish to exit. The dilemma here is if you are too aggressive with your exits, you run the risk of missing out a potential larger move. And if you are too lenient with your exits, you run the risk of forgoing potential profits. So, it is always a fine balancing act. But, if you have a re-entry plan in place, you can choose to adopt an aggressive strategy for your exits.
3. An example of aggressive exit strategy is say exiting when the price falls more than X% from the 52-week high. This X% can be again 20% to slightly bigger number. The idea here is to exit when the tide turns. Every stock goes through ups and downs and there will be periods of under performance which can happen either via sideways consolidation or a drop in price.
4. Reliance Industries for instance was in a consolidation for several years before it started rising a few years ago. So was the case with stocks such as TCS and SBI which were largely range bound for varying lengths of time.
5. You can also use relative strength study to complement your exit strategy. If a stock or sector gets into a underperformance cycle, it will take a while to recover. Typical recent example would be the pharma sector from March 2015 until January 2020 when the sector was under performing while Nifty 50 was marching higher. Your exit strategy would have helped you ease out of these stocks at the early stges of under performance.
If you are someone with limited time to study or monitor your portfolio holdings, then a simple close below the 200-day moving average would be an easy and effective exit strategy. I can talk about more strategies but you need to be aware of certain other charting methods to adopt and implement them. Please mail me if you need any further help, especially if you are not allergic to technical analysis.
Regards
B.Krishnakumar
Hi,
towards the end of the article you have suggested: “I cannot emphasise this enough – have a clearly defined exit plan for your existing equity holdings and stick to it.”
Any suggestion you might like to give on exit plan?
Regards,
Biren
Hi,
I assume your recommendation to have an exit plan applies to direct stock investing. How should we interpret your analysis specifically for lumpsum investing in mutual funds (not SIPs)?
A short term exit strategy does not apply to mutual fund investing, so should we keep a significant liquid component in anticipation of a correction, should we phase a lumpsum entry into select funds or should we go all in assuming a prolonged rally or at least a holding pattern?
I interpret your article as recommending the third option, but would like to get your views.
Hello:
When I talk about the exit plan, I refer specifically to direct stock investments and lumpsum investment in mutual funds. For SIPs, I presume you have a different plan of action and objective associated with it. If not, you can consult your financial advisor regarding handling of SIPs.
I would never recommend going all in, if you are not into full time investment. If you are engaged in full-time job, then always use a staggered approach to investment, be it direct stock investing or lumpsum mutual fund investment. I personally invest in thirds, meaning, I take an initial entry with 1/3rd quantity or amount. Once I get confirmation from price action, I would go ahead with the second tranche and then the final one.
I would not initiate any investment decision based on anticipation. When we anticipate, we can easily be biased. This is why having an exit plan is recommended. Hope this helps.
Regards
B.Krishnakumar
Hi Krishna Kumar
Trust you are doing fine. I have a difference of opinion on the box size used in the point and figure chart. Would like to know the basis for arriving at a 15 point box size.
Hello:
Am doing good, thanks. Can you please elaborate what is the objection regarding the choice of box size? We can take the discussion forward once I understand what your concern is. The choice of box size depends on the time frame you wish to analyze. Smaller the box size, shorter the time frame you are analysing and vice versa. I have used 0.1% of the current Nifty price as the box size. Instead of plotting it in a log scale, I used absolute value of 15-points which is roughly 0.1% of current nifty value of 15,650.
You can of course choose any other percentage or value based on how much noise you wish to accomodate in your chart & analysis.
Regards
B.Krishnakumar
Based on your prior technical read on nifty https://www.primeinvestor.in/nifty-50-outlook-index-hints-at-correction/
I was expecting a correction to 13.5k and obviously, that did NOT happen; but like all techies, you had left some caveats, to go back on that, if nifty Xes a threshold and it happened. I missed out on the rally, for the most part. This time, when you are predicting a bull case scenario, I am going to act the other way, and as I type this, there is 1 % fall and I hope that the fall continues !!
Hello:
Am happy and relieved that someone brought up this angle. I do not have a crystal ball to accurately predict what can happen in the future. We are dealing with probabilities and hypothesis here. So, in any decision based on probabilities, we should look at a large sample size to understand the efficacy.
I got it wrong, or partially wrong in the first instance where I anticipated a fall. The first target was achieved and the second one did not materialize. I also wrote a subsequent post that small and mid cap stocks are outperforming. And this target and view played out. There was money to be made by investing in mid small cap stocks in the past few months. They have done exceedingly well.
Now, the more important question. Will this recent bullish view play out or will it be a flop again like my previous view. I really don’t know. And am sure none of us have 100% winning track record irrespective of whether you take decisions based on fundamental research or technical research. I definitely do not claim to have 100% track record in anticipating market direction and targets. And I have fair share of losing trades and bets.
But I can say with confidence that I end up being on the right side of the markets more often than not. And this is good enough to make money consistently in stock markets. My winning bets give me so much more returns that the losses from the losing trades appear minuscule.
Hope this helps. And of course, I will be happy if you make money either by following my view or otherwise. But, I will be even more happy if someones benefits and makes money based on my view and posts.
Cheers & best wishes
B.Krishnakumar
Krishna…..You have hit the mark this time. Go to ack that. Given the rally in the market, 16300 had come and thankfully, I did not act on the plan, to go in the opposite direction, as I wrote above on June9th. Now that 16300 has been crossed decisively, can you pl take a fresh look and thump the table, with more conviction that 16,695 and 18,630 (especially, the 2nd target of 18.630) will come? Thx a ton
Kalyan
Hello:
Thanks a lot for your feedback. We will soon come up with an update on Nifty with revised targets and scenarios.
Regards
B.Krishnakumar
Mr. Krishna kumar’s article is crisp, brief , with clarity. Thanks
Hello:
Thanks for your feedback.
Regards
B.Krishnakumar
Wonderful article. Thanks for posting the technical views on the possibilities.
My question is why do you say that the alternate scenario is not a preferred scenario? What factors you consider to arrive at this conclusion.
Secondly, if you fresh money to invest at this stage, what would be the trigger level on the upside you would recommend to go ahead and invest?
Hello:
The technical indicators and the patterns do not justify entertaining a bearish case scenario. I am not getting into justification based on fundamentals. Based on the chart analysis and breadth indicators, there is no reason to be negative on the markets. This would be the outlook until there is a contra indication from the price action in the future.
If you want to invest fresh money into the markets, please do so after consulting your financial advisor. And,if you have a clearly defined exit plan, then I see no problems with fresh investments. But, please consult your advisor. Personally, I will increase equity exposure and I am clear about my exit plan. If I see warning signs unfold, I will trim my exposures accordingly.
Hope this helps.
Regards
B.Krishnakumar
…so its all good till its good is what i have understood. Appreciate the heads-up …..i guess what i hear from you folk 30 days from today (covid spread willing) wiil probably serve as a more stable indicator for future times. Thank yu
I am logged in but still not able to read the article!
Sorry about that. Please try now…
Comments are closed.