![]() In the previous update on the Nifty 50 index, we had mentioned that the Nifty 50 index could retest or drop below the March low of 15,700. Since then, this scenario played out; the Nifty 50 dropped to a low of 15,183 on June 17 and has since been on a recovery path. Many of you have asked us where the Nifty 50 stands now. Here’s the view as the charts show.
In the previous update on the Nifty 50 index, we had mentioned that the Nifty 50 index could retest or drop below the March low of 15,700. Since then, this scenario played out; the Nifty 50 dropped to a low of 15,183 on June 17 and has since been on a recovery path. Many of you have asked us where the Nifty 50 stands now. Here’s the view as the charts show.
Where does the Nifty stand
To address the question of what next for the Nifty 50, let us first take a quick look at the weekly chart of the index.
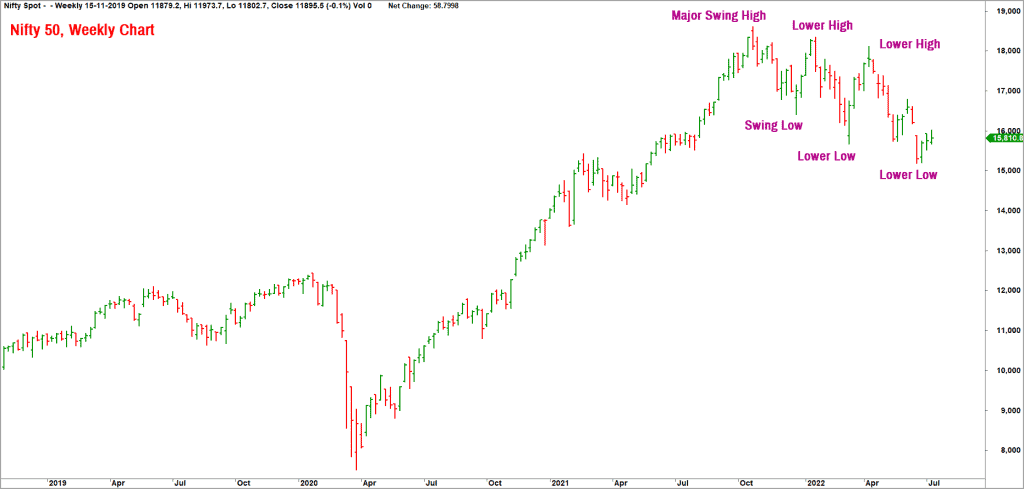
As highlighted in the above chart, the bearish sequence of lower swing highs and lower swing low remains undisturbed. This suggests that the undertone in the index remains in the bigger time frame. The Nifty 50 index has to move above the recent swing high of 16,795 to disrupt this sequence of lower highs and lower lows. Therefore, until the index moves past 16,800, there is no merit in thinking about the Nifty 50 having made a significant low or about the possibility of a fresh high.
Let us now move to the more familiar territory of the Renko chart and PF-X% breadth indicator to assess the short-term picture of the potential downside targets. Featured below is the Nifty 50 Renko chart plotted using the 0.5% brick size. This captures the short-term (4-6 weeks) outlook for the index.
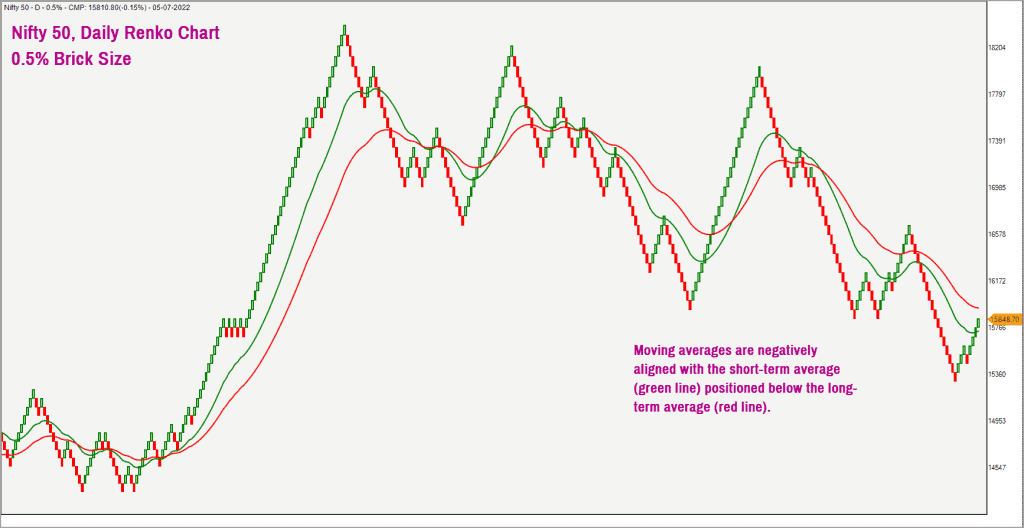
The two moving averages in the above chart are negatively aligned, confirming the bearish trend. Besides, the prior oversold condition in the chart has been addressed by the recent recovery in the index. The price has now pulled back to the moving average and the reversal today indicates that the short-term downtrend has probably resumed.

The short-term breadth indicator is also in agreement with the expectation of the short-term weakness. The breadth indicator of choice is PF-X% indicator which captures the percentage of stocks that are in a bullish swing in the Point & Figure chart. To study the short-term breadth, we use the PF-X% indicator in the 1% box size Point & Figure chart.
The PF-X% breadth indicator is now at an overbought zone of 80%. The overbought reading in the breadth indicator is a sign that the scope for a sustained rise in the Nifty 50 index would be limited unless there is a cool off or at least a sideways consolidation in price.
Based on the intra-day Point & Figure chart of the Nifty 50 index, the immediate downside target works out in the 15,350-15,400 zone. A drop below 15,350 would confirm the case for a slide to 15,060-15,100.
A look at the PF-X% breadth indicator in the medium-term time frame (captured using the 3% box size Point & Figure chart) also indicates relative weakness. While the Nifty 50 has recovered from the June 17 low of 15,183 to a high of 16,025 on July 5, the PF-X% breadth indicator in 3% brick size has barely recovered from a low of 16% to current level of 20%.
This indicates that the rally in the Nifty 50 index has been driven primarily by a handful of index heavyweights and the majority of the stocks have not participated in the recent leg up. This again gives credence to the underlying weakness and strengthens the case for short-term weakness.
What about broader markets?
If that’s the picture for the Nifty 50, what is the case for stocks outside this bellwether? Here is a quick outlook for the broader market. For this, we use the Nifty MidSmallCap 400 index.
Let us get started with the weekly ratio chart of this index versus the Nifty 50 index to study the relative performance.
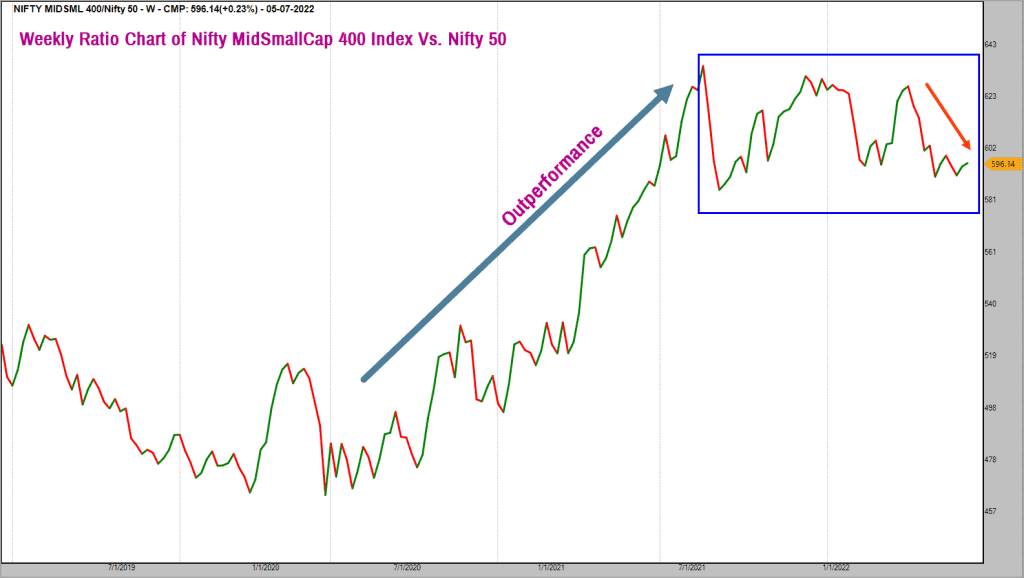
As highlighted in the chart above, the ratio chart has been range bound since July 2021, indicating that the performance of this index has broadly been in sync with the Nifty 50 index. More recently, the ratio chart is trending down (since April 22, 2022) suggesting underperformance of the mid-and-small cap stocks.
Unless the ratio chart moves above the high recorded on April 22, there is little merit in focusing on the broader market. Besides, similar to the Nifty 50 index, the Nifty MidSmallCap 400 index is also in a downtrend with a clearly evident lower high and lower low pattern in the weekly chart. Based on the candlestick chart study and the Point & Figure chart, the immediate downside target for the Nifty MidSmallCap 400 index works out to 8,200-8,500.
There is no meaningful improvement in the breadth indicator either. It would therefore be prudent to wait for the Nifty MidSmallCap 400 index to close above 10,500 and the ratio chart (versus Nifty 50) to move past April 2022 highs before considering exposures in the broader market.
To summarise, the short-term outlook for the Nifty 50 index remains bearish but I am not looking for any serious cut. A test of 15,050-15,100 is likely. We will come up with fresh updates and targets when the Nifty either drops below 15,000 or moves past 16,800.


4 thoughts on “Technical outlook: Where does the Nifty 50 stand?”
The Nifty Midcap 100 and Smallcap 100 indices have gained 20 percent and 19 percent, respectively. And…the number of stocks above 200 DMA has reached 43 percent from 14 percent in June 2022 for NSE500…all these sudden reversals point that once more it has been absolutely difficult to gauge the direction
Hello:
It is difficult to predict market direction and price reversals that are this swift are identified more on hindsight. With the then available data points, the logical conclusion was continuation of the downtrend. That did not play out. We shall come up with an updated view on Nifty 50 index this weekend.
Regards
B.Krishnakumar
16800 is broken easily and we are way past that now, with roaring green days of gap ups every day. FIIs have turned in as buyers (after selling at sub 16k and now buying at 17k plus)… are you coming out yet another, where does nifty go from here…
PS – I too guessed it totally wrongly, waiting for the fall to 15k and waiting in sidelines
Hello:
Yes, the market has turned around very rapidly and has forced many investors to remain on the sidelines. We shall come up with an updated Nifty outlook this weekend. So, stay tuned.
Regards
B.Krishnakumar
Comments are closed.