The author is an external contributor. Views are personal and do not reflect the opinion and views of PrimeInvestor.
We have been advising caution and highlighting that the risk-reward is not favourable for fresh exposures over the past few updates on the Nifty 50. Besides, we have also been emphasising the need to focus on exit strategy. Hope these pointers were helpful in tiding over the recent volatility and sharp cut witnessed in small & mid cap stocks!
In the previous update on the Nifty 50, we had mentioned 21,200 – 22,200 as the broad range for the Nifty 50 index. Though the index crossed the upper boundary, it could not sustain there for long. After nudging above this for a few days, the index is now back into the 21,200-22,200 range.
We shall focus on the short-term outlook for the Nifty 50 index and do a deep dive into the Nifty 500 universe as well.
Nifty 50’s short-term outlook
Here is the daily candlestick chart of the Nifty 50 index.
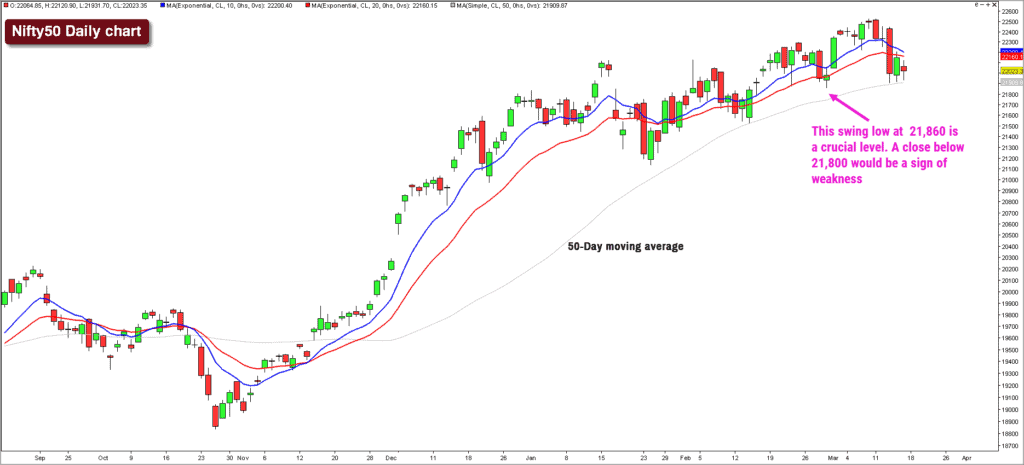
It is interesting to note that the Nifty 50 index has dropped a little over 3% from its recent high of 22,526. And the price is still tracing out a bullish sequence of higher highs and higher lows. Hence, there is nothing alarmingly bearish in the Nifty 50 index for now.
A fall below the recent swing low of 21,800 would be the first sign of weakness and it would invalidate sequence of higher lows. The Nifty 50 index is also currently hovering just above its 50-day simple moving average at 21,910.

While there is no cause of concern for now, let us also consider a few red flags as far as Nifty 50 concerned. Remember, we have been highlighting that the breadth in the higher time is extremely overbought and needs to correct. This cool-off has begun and the short-term breadth has already recovered from the oversold levels.
The medium-term breadth indicator has also cooled off from overbought levels but is yet to reach oversold levels. And the long-term breadth indicator is still in the overbought zone.
Hence, a short-term bounce is not ruled out in Nifty 50 index. But for the uptrend to resume in full force, the index has to cross the recent high of 22,530. Until then, expect the downward drift to persist. Volatility will be elevated as well.
I am personally not in the camp that is expecting a sharp rally in the Nifty 50 index anytime soon. This view would be subject to reassessment if the index closes above 22,600. On the other hand, if 21,200 breaks, then expect further cut in the Nifty 50 index.
While the Nifty 50 index is hardly 4% off its all-time highs recorded earlier this month, much of the pain is centred around the broader markets. The mid and small cap stocks that were stark outperformers in 2023 have taken a brutal hit in the past few weeks.
Dissecting the broader markets
That brings us to the Nifty 500 index. The Nifty 500 universe consists of the top 500 companies based on the total market capitalisation. It represents about 93% of the free float market capitalization of the stocks listed on NSE. The image below shows the break-up of the Nifty 500 universe.
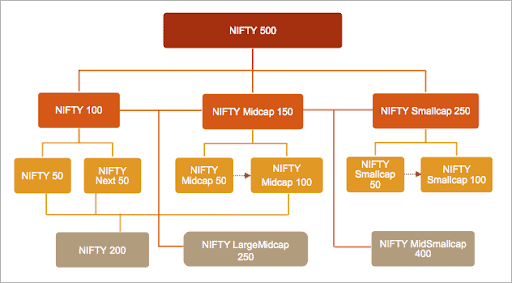
We shall dig deeper into the top tier of the above diagram – the Nifty 50, Nifty Next 50, Nifty Midcap 150 and the Nifty Small Cap 250 index. We have already covered our Nifty 50 outlook. We shall take a closer look at the remining three components.

Overall trends
Have a look at the extreme short-term breadth indicator of these four indices. The indicator presented in the chart below captures the percentage of stocks trading above their 21-day exponential moving average.
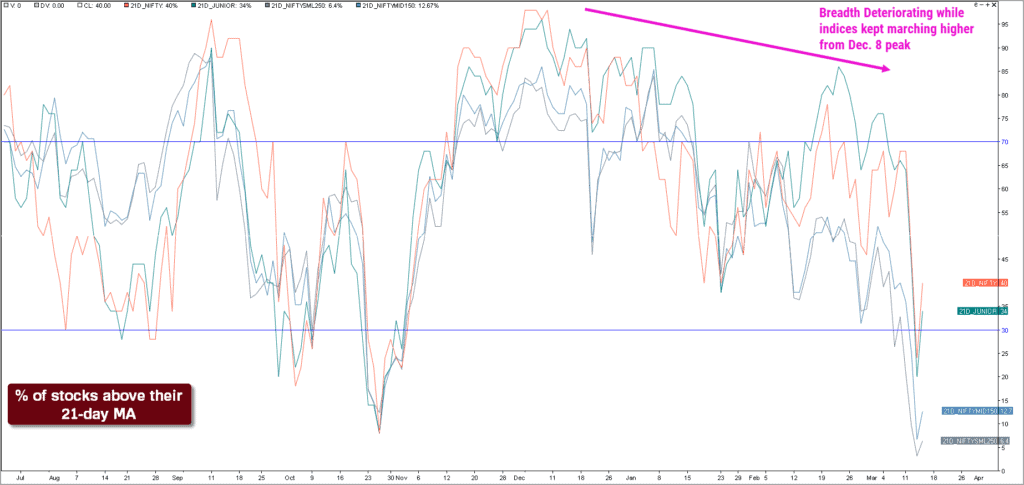
It is interesting to note that:
- The breadth indicator for all four indices topped out on December 8.
- The Nifty SmallCap 250 index and the Nifty MidCap 150 index have been seen a steady deterioration in the breadth thereafter. Remember, all the four indices continued to march higher and peaked out couple of months later.
- The above short-term breadth indicator has been sliding lower indicating negative divergence or thinning out of participation.
There are more interesting trends to note. One, the Nifty 50 index remained bullish all along and managed to hit new all-time highs in March. But the Nifty SmallCap 250 scaled an all-time high on February 8 and has since been in a sharp fall. The Nifty SmallCap 250 index is down almost 11% from the February highs while Nifty 50 is down just 4%. The MidCap150 index is down 6.6% from the recent highs. Two, headline indices have masked the underlying deterioration and distribution that was happening all along in the broader markets.
All these data points suggest that the broader markets have been at the receiving end and borne the brunt of the damage. This divergence in short-term breadth along with the overbought conditions were the primary reasons behind us sounding cautious in the past couple of updates. And this is why we have been consistently emphasising the need to focus on exits and how the price is overstretched. Now, let’s dig deeper into each index.
Trends in the Nifty Next 50
The Nifty Next 50 index has displayed signs of relative outperformance versus Nifty 50 in the past few months. This index is down about 5.5% from the recent highs. A look at the short-term breadth chart also confirms relative strength of this index versus the Nifty 50. The 21-day moving average breadth has been relatively strong all along and has seen a strong bounce when the Nifty recovered on Thursday.
Similar to the Nifty 50 index, the short-term technical set-up has not turned outright bearish for the Nifty Next 50. Only a fall below 55,600 would be an early sign of weakness. Until then expect some volatile sideways action to persist.
We do not recommend fresh exposures in this segment until there are signs of the Nifty fall arresting. Until then, focus on managing the existing holdings from this segment. Fresh exposures may be considered on if Nifty moves past at least 22,600 – and also check if the index continues to outperform the Nifty 50 index.
Trends in the Nifty MidCap 150 Index
This index has witnessed a deeper cut of almost 6.7% from the recent highs. What is even more revealing about the damage and recent underperformance is the fact that 55 stocks from this universe have seen a cut of more than 20% from their 52-week high. Almost 45 stocks witnessed a drop of more than 10% since February 8, 2024, when the index hit its all-time high.
The short-term outlook is bearish for this index and only a move above 18,400 would reinforce bullishness. A fall below 16,500 would be further sign of weakness and could push the index to the 15,500-15,800 zone.
Given the relative weakness and the sharp sell-off in quite a few stocks, it would be prudent to avoid fresh and increasing exposures in this segment for now. Focus on the exit strategy for the existing exposures from the midcap space in stocks. Wait for a breakout above 18,500 and also for the signs of relative outperformance versus Nifty 50. Until then, stay away from this segment.
Trends in the Nifty SmallCap 250 Index
This index has been the most hit from the Nifty 500 stack. It may be recalled that this index was the top outperformer from March 2023 until February 2024. As highlighted earlier, there has been a steady deterioration in the breadth since December, and this index has got into a sharp correction off its peak recorded on February 8.
The SmallCap250 index has seen a cut of 10.4% from its February peak. The actual damage is evident from the fact that 134 stocks out of the 250-stock universe have witnessed a fall of more than 20% from their 52-week high.
The technical structure in this index is relatively worse compared to the Nifty with the price tracing out a bearish sequence of lower highs and lower lows. In the current environment, there is no reason to look for fresh exposures from this space. Focus on managing the existing holdings and wait for signs of upside breakout in price and relative outperformance. Until then stay away.
Only a move past 15,300 would be a sign of strength in the SmallCap250 index. On the other hand, a fall below the swing low at 13,100 would be a major sign of weakness and could spell more trouble for the small cap stocks.
To summarise, the Nifty 50 index and the Nifty Next 50 index appear relatively strong and haven’t triggered bearish signals yet. The broader markets are distinctly weak and are underperforming the largecap counterparts. Unlike the April 2023-Decemebr 2023 period, the price action is getting very stock-specific in the broader markets.
In one of the prior updates, we highlighted instances where a euphoric rise has led to an equally dramatic correction in quite a few stocks and other asset classes. Looking at the recent performance of the erstwhile gainers from the PSE, PSU Bank, and small cap stocks, it appears as though this phenomenon is already playing out.


4 thoughts on “Technical outlook: Short-term trends in the Nifty 50”
Excellent analysis. Can you please delve deeper into sector specific indices to make the analysis deeper, for example, Consumer, Pharma , Metal , FMCG, IT along with Real Estate ?
Brilliant
Any updates on Bank Nifty?, previously remember you have stated a close above 49000 will indicate bullishness .
Hi Srikanth:
Bank Nifty showed a little bit of promise but it is still a relative under-performer compared to Nifty. Bank Nifty is yet to make a fresh all time high but Nifty & Next 50 have done so. Hence Bank Nifty remains a sort of a stumbling block for Nifty’s progression. Let the index cross 49,000 before considering any bullish thoughts. For now, the recent price action looks promising but nothing enticing enough to consider exposures in private sector banks.
As always, we shall keep you updated when there is a change in our assessment.
B.Krishnakumar
Comments are closed.