The author is an external contributor. Views are personal and do not reflect the opinion and views of PrimeInvestor.
In the previous update on the short-term trends in the Nifty 50 we mentioned that there is nothing bearish in the Nifty 50 chart and only a fall below 21,800 would be a cause of concern. We had also highlighted the deterioration in the broader markets and that the action could get more stock specific.
This scenario has played out with Nifty Next 50 being the top performer in the past few months while the mid-cap and small stocks have sort of taken a backseat. A look at the recent price action indicates that both Nifty 50 and Nifty Next 50 indices have pushed well past their recent highs while the Nifty SmallCap 250 index hasn’t crossed above its recent high recorded on February 8, 2024.
Clearly, there is a glaring divergence between the large caps and mid-caps and focus seems be centred around the former. The question now is – what is in store for Nifty 50 in the short-term?
We will address this in today’s update, along with a look at gold.
Nifty Short-Term Outlook
Here is the daily chart of the Nifty 50 index. As highlighted in the chart below, the price is still tracing out a bullish sequence of higher highs and higher lows.
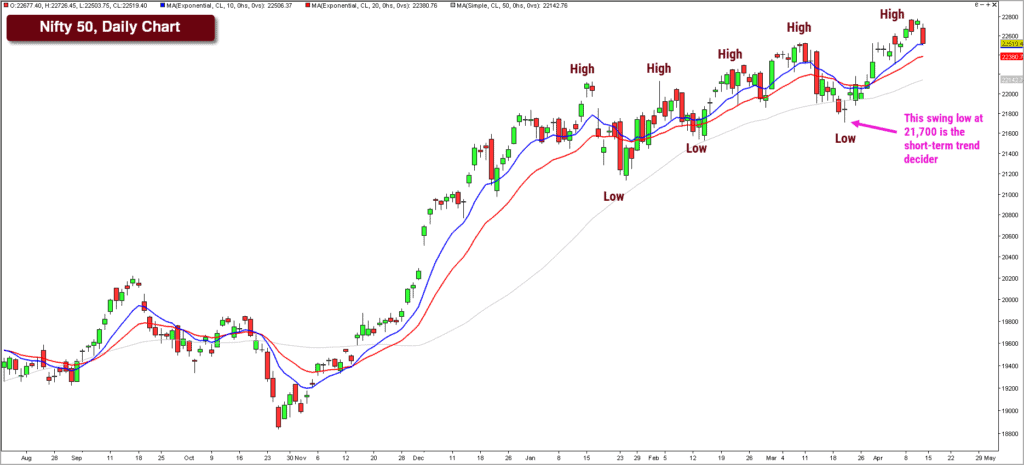
The short-term trend will turn bearish only if the price falls below the most recent swing low at 21,700. A close below this level would violate the sequence of higher highs and higher lows and would also result in a breach of the 50-day moving average which is currently at 22,142.
A look at the breadth indicators suggests a possibility of a short-term correction. The PF-X% breadth indicator, in the short-term, has reversed from overbought zone. But the negative divergence between the price action and the breadth indicator suggests that the index is moving ahead with fewer stocks participating in the rally.
This negative divergence along with the flip lower from overbought zone strengthens the possibility of a short-term pull-back in the Nifty 50 index. The breadth in the medium term is still in the neutral zone and does not indicate the possibility of a sharp cut for now. The only cause of concern is the breadth in the long term which is still in the overbought zone.
A break below 21,700 would open up the possibility of a much severe cut in the Nifty 50. But, for now, I would not speculate on that possibility. We shall come up with timely updates based on the unfolding price action.
For now, there is a case for a short-term pull back in Nifty but it is unlikely to morph into a trend reversal until 21,700 is breached. Below 21,700, the Nifty 50 index could slide to the next support zone at 20,900-21,000. A breach of 20,900 would make us really worried about the sustenance of the medium-term uptrend.
The expectation for now is a short-term correction, followed by the resumption of the medium-term uptrend.
Nifty Smallcap 250 Index
As highlighted in the previous update, this index, along with the MidCap150 index have underperformed Nifty 50 & Nifty Next 50 indices in the past few months. While the Nifty & Next 50 indices have raced to fresh highs recently, the Smallcap 250 is yet to do so. Have a look at the daily chart of the Nifty Small Cap 250 index featured below.
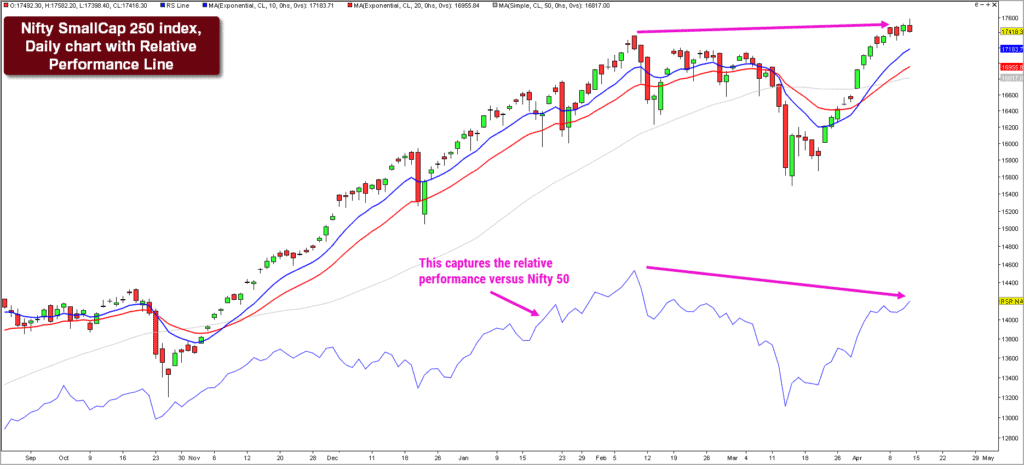
As highlighted in the above chart, there is a glaring divergence in the relative performance of the SmallCap 250 index versus Nifty 50. The thin blue line in the above chart captures the relative performance. Notice how the price has reached prior highs while the relative performance line is yet way below the corresponding highs.
This suggests that one should be cautious towards the broader markets and reduce aggressive exposures here until there are signs of a resumption of outperformance of the Smallcap 250 index.
A drop below the recent swing low of 13,000 in this index would indicate the reversal of the uptrend and could lead to a much deeper cut. Be cautious and as we have emphasised in several recent posts, focus on exit criteria in the broader market exposures.
Comex Gold
We haven’t covered the performance of gold in these technical index outlooks. However, we are taking a look at gold today. The yellow metal has grabbed headlines recently when it scaled fresh all-time highs and the recent geopolitical tension is also likely to enhance the appeal of gold as a safe haven asset, and therefore, it seems at interesting opportunity to explore now.
Here is the monthly chart of Comex gold futures, capturing price in US Dollar per troy ounce.
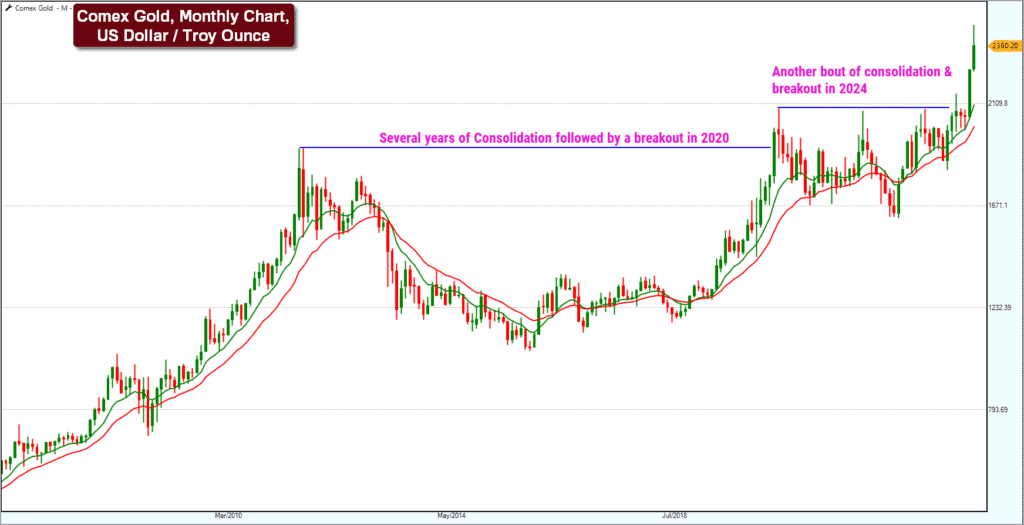
Notice how the price has consolidated for several months prior to the recent breakout to new highs. Typically, a breakout from such prolonged consolidation results in a strong momentum move in the direction of the breakout.
Using the Point & Figure chart, we have calculated the probable short-term targets for Comex gold. The chart below showcases the targets for gold.
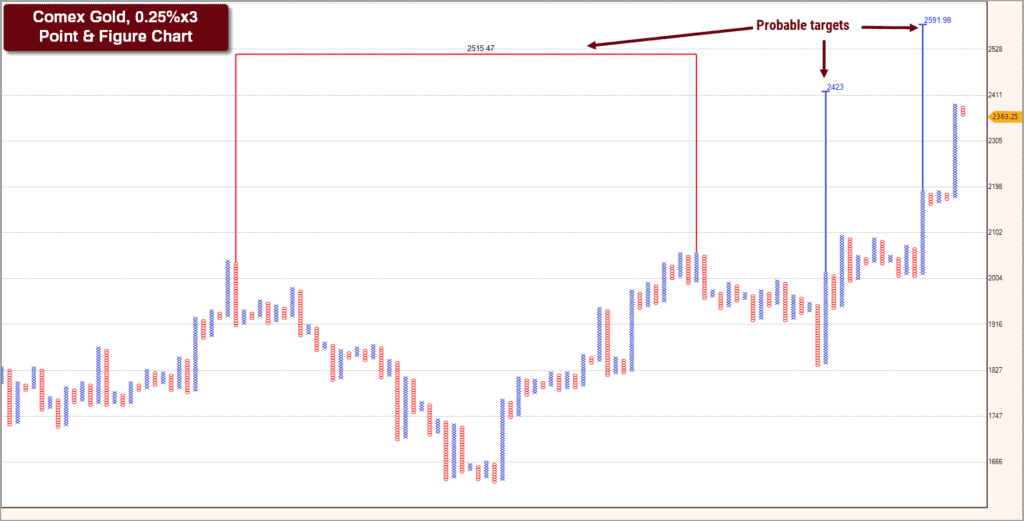
As highlighted in the above chart, comex gold could head to the short-term target of $2,423 and there is also a target cluster or confluence at $2,515-2,598 zone. These are the levels to focus on; the possibility of a rally to these targets would be negated if the price falls below $2,000 level.
Considering the recent spike in gold prices, there is a case of a short-term cool off to happen. But the long-term trend is bullish. Also of interest is the recent signs of outperformance of Goldbees Vs Niftybees. Taking some exposure to gold, especially on weakness, might not be such a bad idea in the current environment.
Sector-wise trends
Sector-wise, there were green shoots in the Nifty Bank index. This index displayed upside momentum and also showed signs of relative strength versus the Nifty 50. It remains to be seen if this persists. The recent swing low of 44,000 is the deal breaker for now. Below 44,000, Nifty Bank could get into a deeper correction and could also potentially reverse the recent relative strength versus Nifty 50.
The Nifty IT Index too has displayed green shoots in terms of price action. But the IT index is yet to display relative outperformance versus Nifty 50 index. It would not be out of context to monitor the relative performance chart of Nifty IT index versus Nifty 50 index. Any signs of outperformance along with signs of resumption of uptrend in Nifty 50 could be the ideal spot to scout for opportunities in the IT sector. Remember, the IT index has been in a downtrend and has been a gross underperformer for over two years now.
To sum up, be cautious in equity markets in the short-term. There are no signs of reversal of the medium-term uptrend yet. Focus on managing existing equity holdings and avoid fresh exposures, especially in the broader markets for the time being.


1 thought on “Technical outlook – Nifty 50 in the short term”
Hi,
While your prudent suggestions to ”focus on exit criteria” since last 2 posts with ref to mid and small cap space, can you please guide us further on how to exit / strategies to exit from this space specifically? What steps / process one should adopt to exit from this space? Since the run up in mid and small cap space was great, many of us have build a significant position.
Thanks in advance.
Comments are closed.