The author is an external contributor. Views are personal and do not reflect the opinion and views of PrimeInvestor.
As observed in the previous update on the Nifty 50, the Nifty 50 index got into a correction. However, on the positive side, the index did not break below the first trigger level of 19,300 that we mentioned in last month’s update. Though the Nifty breached this level on a couple of days, the index managed to rebound with ease thereafter. So, this level of 19,250-19,300 remains a crucial reference point from the short-term perspective.
In this update, let us address the current technical set-up for the Nifty 50 index. We shall also discuss the prospects for the Nifty MidSmall Cap 400 index which has been in the spotlight since start of the rally off March 28 low, and which has built up key interest now.
Short-term outlook
As always, we shall begin with a look at the daily candlestick chart of the Nifty 50 index.
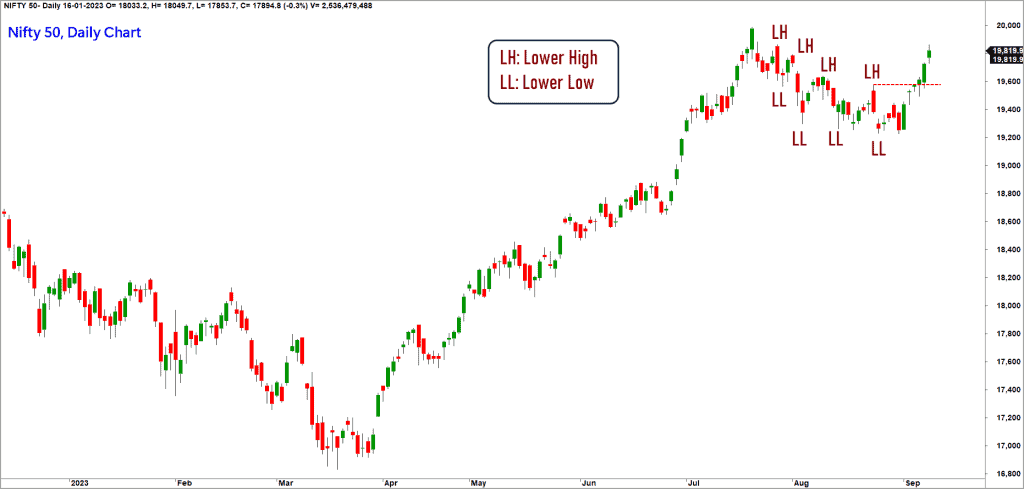
As highlighted in the chart above, the price was tracing out a bearish sequence of lower highs and lower lows. This bearish sequence has been reversed by the recent rally. The price has crossed the prior swing highs suggesting the reversal of the short-term bearish trend. As long as the Nifty 50 index sustains above 19,250, there would be a strong case for a rally to the short-term target of 20,400-20,500 range.
Let us also check if the short-term bullish view is corroborated by the breadth indicator.

We will stick to the reliable PF-X% indicator as our breadth indicator tool. This indicator tracks the percentage of stocks in a bullish swing in the Point & Figure chart. The PF-X% in the short-term time frame is at 74% suggesting that it is not overbought yet. In strong momentum phase, this indicator has reached elevated level of 90%+. Given this backdrop, there is scope for short-term rally in the Nifty 50 index.
Other indicators
One striking feature of the rally off the March lows is that that the uptrend in Nifty 50 has been powered by the underdogs of the index. Remember, the top 10 index heavyweights account for 58% of the total weightage. But the recent rally has been propelled mostly by the stocks outside of this top 10 bracket.
This observation is evident from the relative outperformance of the Nifty 50 Equal Weight Index in the past few months. Have a look at the ratio chart of Nifty 50 Equal Weight Index versus Nifty 50.
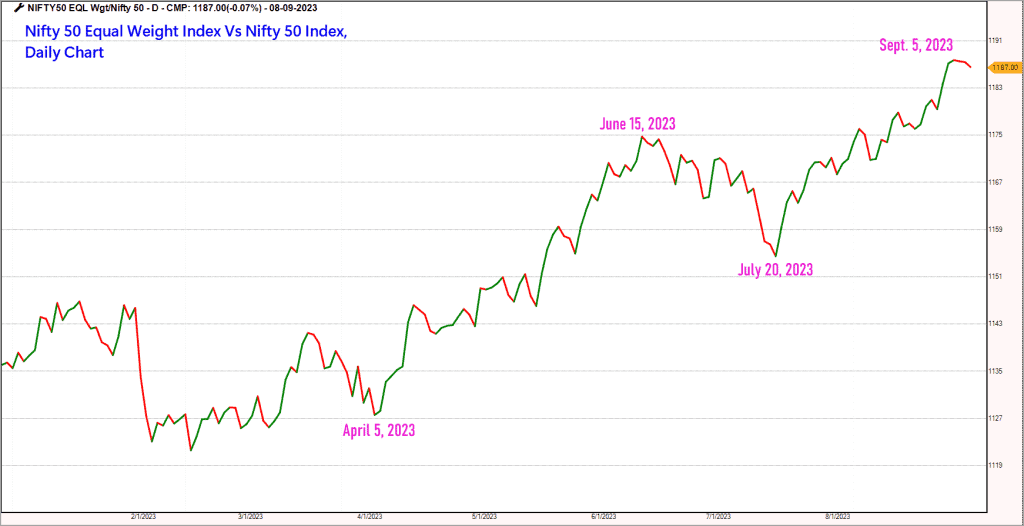
It is evident from the above chart that the equal weighted index has outperformed the market cap weighted Nifty 50 index, suggesting that the top heavyweights have not fired as much as the rest of the constituents.
A closer look at the rally off the August 31 lows suggests that there is a possibility of the top 10 heavyweights to do the heavy lifting this time around. In the ratio chart displayed above, the price has turned lower in the past few days, suggesting underperformance of the equal weighted index in the extreme short-term. This in essence means that the top 10 candidates have been gaining some traction in the past few days.
If this trend persists, it would not be unreasonable to expect a rapid move in the Nifty 50 index towards the short-term of 20,400-20,500. However, if the recent support-cum-swing low of 19,250 is breached, it would indicate short-term weakness and could open further downside in the index.
Two, it is comforting to note that the PF-X% breadth indicator in the medium-term time frame too has cooled off from the overbought zone and is currently in the neutral zone of 74% suggesting that there is room for short-term rally to continue.
Three, the influential Nifty Bank index has also displayed early signs of outperformance in the past few trading sessions. As we have been mentioning over the past few updates, the underperformance of the Nifty Bank index has been one of the sticky points recently. In this context, the recent price action looks promising and as long as the Nifty Bank index sustains above 43,400, expect a short-term rally to 46,500-47,000.

It is crucial for the Nifty Bank index to fire in order to help Nifty 50 reach the short-term targets. Hence, keep an eye on the performance of top index heavyweight banking stocks such as HDFC Bank, ICICI Bank, Axis Bank and Kotak Mahindra Bank. Some traction in these stocks would make the upward journey for the Nifty 50 index more seamless.
Nifty MidSmall Cap 400 index
The spotlight of the rally off the March lows is the strong participation of the broader markets. The sustained improvement in the breadth of this index has been an interesting aspect, suggesting that the rally has been broad-based.
However, the uptrend in this index in the past few weeks has turned parabolic suggesting that things are getting overheated. A look at the breadth indicator of the index corroborates the overheated condition.
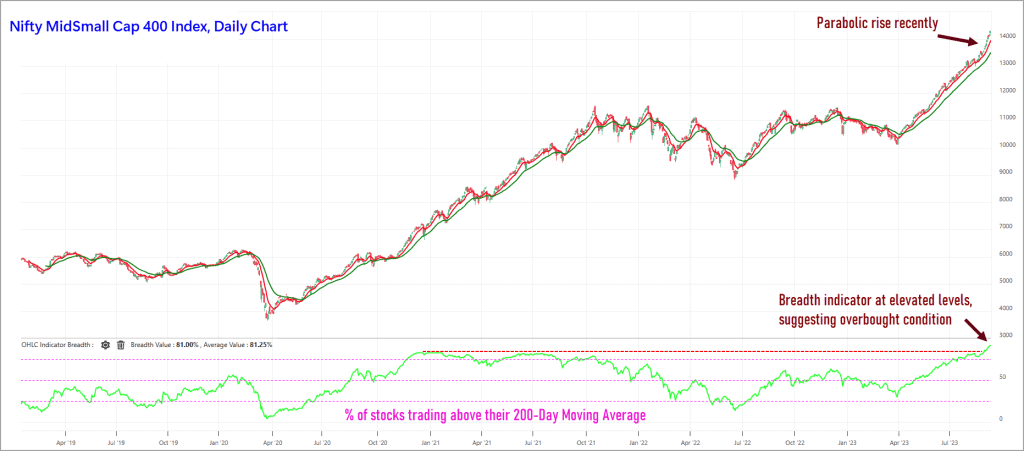
The breadth indicator capturing the percentage of stocks trading above their 200-day moving average is displayed in the lower pane in the above chart. It is apparent that the breadth has reached extreme overbought condition.
This in itself does not mean that the index could get into a cool off phase. The overheated breadth is typically a forewarning to an impending correction or consolidation.
Until there is evidence from price action, there is no merit in second-guessing the start of the impending correction. For now, there is no such evidence of weakness yet in the price action. Hence, it would make sense to operate on the premise that the uptrend or bullishness would sustain.
But it would not be prudent from a risk management perspective to enhance exposures in the broader markets at this juncture. Ideally, one should be fully invested by now and reaping the benefits of the recent euphoria.
We have consistently highlighted in the prior updates about the relative strength and outperformance of the broader markets. If you are sitting on a portfolio of mid and small cap stocks, then enjoy the party until it lasts. However, be mindful of exiting or at least trimming exposures when the situation warrants.
As emphasised in several prior updates, it is imperative for everyone to have a clearly chalked out exit plan for the stocks held in the portfolio. Remember, entry is a choice, but exit is mandatory. And the exit and its quality would determine your returns. Until you exit, the profits will remain fictional.
Form a price action perspective, the short-term trend in Nifty MidSmall Cap 400 index remains bullish and there is a scope for this rally to extend up to 14,700-15,000 levels. A break below 13,000 would be an early warning of the start of a corrective phase in this index.
Keep an eye on the 13,000-mark and focus on your exit criteria while you enjoy the bull run in the mid-and-small cap space.
To sum up, there is a case for the Nifty 50 index to reach 20,400-20,500 range in the short-term. However, the mid and small cap indices are moving deeper into the overbought zone. Hence a dose of caution is warranted.


9 thoughts on “Technical outlook: Can the resilience of the Nifty 50 continue?”
I really like your quote “entry is by choice, but exit is mandatory” and that every investor should have a clearly chalked out plan for exit for the stocks held in their portfolio.
I always struggle with exit / sell, as I have never been able to have a set philosophy of when to exit a stock. I oscillate between ‘buy once and forget it for very long term’ and ‘book profit at regular interval / during uptrend and enter at lower end again’ philosophies at the portfolio as well as at individual stock level.
Also, there are enough and more ‘buy’ recommendations and entry strategies available to learn from, but there are hardly any pointers on how to build an exit strategy defining when to exit a stock OR book profit at the portfolio level.
It will be really helpful if you could guide / give pointers on how to take sell / exit decisions.
Looking forward to learn your views and strategies around exit.
Thanks
Hello:
Happy to note that our message is read and taken seriously. I strongly believe that everyone is a trader irrespective of whether one acknowledges it or not. Unless you plan to buy something and pass it on to the next generation, you are a trader. Meaning you are buying something with an intention to sell later and make profits in the process. Regarding exit plan, one must choose a strategy that suits one’s psyche. There is no one-size-fits-all approach here.
For long-term holdings (with an intention of not selling them unless there is financial emergency), I prefer index funds / ETFs or ultra large cap stocks.
If you are a long-term trader (call it investor if you will), aiming for returns in excess of 30% in stocks, then the 50-day moving average or the 100-day moving average could be an effective tool to decide exits. You may consider exiting if the stock closes on two successive days below the chosen moving average. A more sophisticated approach could be the use of the Super Trend indicator which is again available for free in most broker terminals and in free charting platforms like http://www.tradingview.com. A close below this indicator could be a logical exit approach for short to medium term momentum trader.
The ultimate exit criteria for long-term traders would be a close below the 200-day moving average. This is ultra conservative approach and one may end up surrendering quite a bit of unrealized gains by the time the price breaches the 200-day moving average. May be you can follow a hybrid approach where you may consider staggered exit using multiple approaches with the 200-day moving average being the final frontier.
You can check historical charts and decide which one is appropriate for your style and risk tolerance. And also remember that stock market investing is always ridden with regrets. So, don’t fret if the stock moves up after you exit. You can always identify numerous other stocks. There is after all 1500+ stocks traded at the exchanges.
Hope this helps.
B.Krishnakumar
Thanks a ton for this very clear exit guide. Something we don’t come across easily. Can you please elaborate a little more on the concept of Super Trend Indicator? What is it? And, does it pertain to the broader market (say, Index) or to individual stocks? E.g. Do we look at the super trend indicator of the broader market and take a sell decision on individual stocks, or do we look at the super trend indicator of each stock?
Thanks again. Super helpful.
Hello Mehul,
The Super Trend indicator is something that you can plot on any price chart, including the index. If you wish to use it as an exit criteria, then plot this indicator in the chart of the stocks in your portfolio. You can choose to exit if the stock price drops below the Super Trend indicator. In essence, look at the Super Trend indicator in each stock.
Again, check the historical performance of this exit criteria and assess if it satisfies your individual requirement.
Hope this helps
B.Krishnakumar
Thank you.
As usual, simple and lucid. Can you highlight possible sectoral outperformance going forward.
Thanks for the feedback. Will include sectoral outperformance going forward.
B.Krishnakumar
Thanks so much the update ☺️, Any view of the IT index ? Is it good to switch from small cap investment to IT index considering the interest in mid and small cap now?
Hello:
Though the Nifty IT index is showing early signs of promise, the relative performance versus the Nifty 50 index is still not impressive. I would give it a few more weeks to assess if the recent recovery in the IT index sustains and more importantly, there should be corresponding improvement in the relative strength too. We will alert once we get a green signal. And of course, Nifty IT index represents large cap IT names. The small and mid cap stocks from the IT basket have much better.
Hope this helps.
B.Krishnakumar
Comments are closed.