The Nifty 50 index has displayed extraordinary strength in the past few months and the index has also hit our target of 19,250-19,300 mentioned in the previous updates. The question now is – what is in store going forward? This apart, what are the sectors to focus on? We will address these two questions in this update.
Nifty 50 – Is the rally over?
A sharp reversal after a strong rally invariably raises the question: Is the rally over? The sharp reversal witnessed on Friday (July 7, 2023) is a worrying sign from a short-term perspective. But I wish to begin with a positive note and hence would like to share that the rally in Nifty 50 could extend up to the 20,250-20,300 range. This view would be valid as long as the index trades above 18,600. This probably would alleviate the concerns of the bullish camp!
To remain balanced, let us also address the multiple red flags that are popping up. These red flags raise concerns about the sustenance of the short-term bullishness.
The first factor is the overbought scenario in the breadth indicator across multiple time frames. As always, we use the PF-X% indicator to assess short-term breadth. This indicator tracks the percentage of stocks in a bullish swing in the Point & Figure chart.
The PF-X% breadth indicator has reached the overbought zone in short-term, medium-term as well as the long-term time frames. This in itself is not a reason to expect trend reversal, but most trend reversals or corrections are preceded by an overbought breadth reading. Remember, theoretically, the breadth can remain overbought for several weeks / months, but it cannot remain overbought forever.
A study of historical precedence suggests that the price has got into a significant correction every time the breadth indicators across multiple time frames have reached the overbought zone. The most recent such occurrence was in September-October 2022. And we are aware of what transpired thereafter.
It would be pertinent to point out that though the breadth had reached the overbought zone back in September, the Nifty 50 index actually topped out a few months later in December 2022. So, there is no need to press the panic button just yet. But a bout of caution would not hurt in such a scenario.
The second factor is, apart from the elevated breadth, there are signs of slowdown in momentum. Here is the Nifty 50 Renko chart plotted in 3% box size.
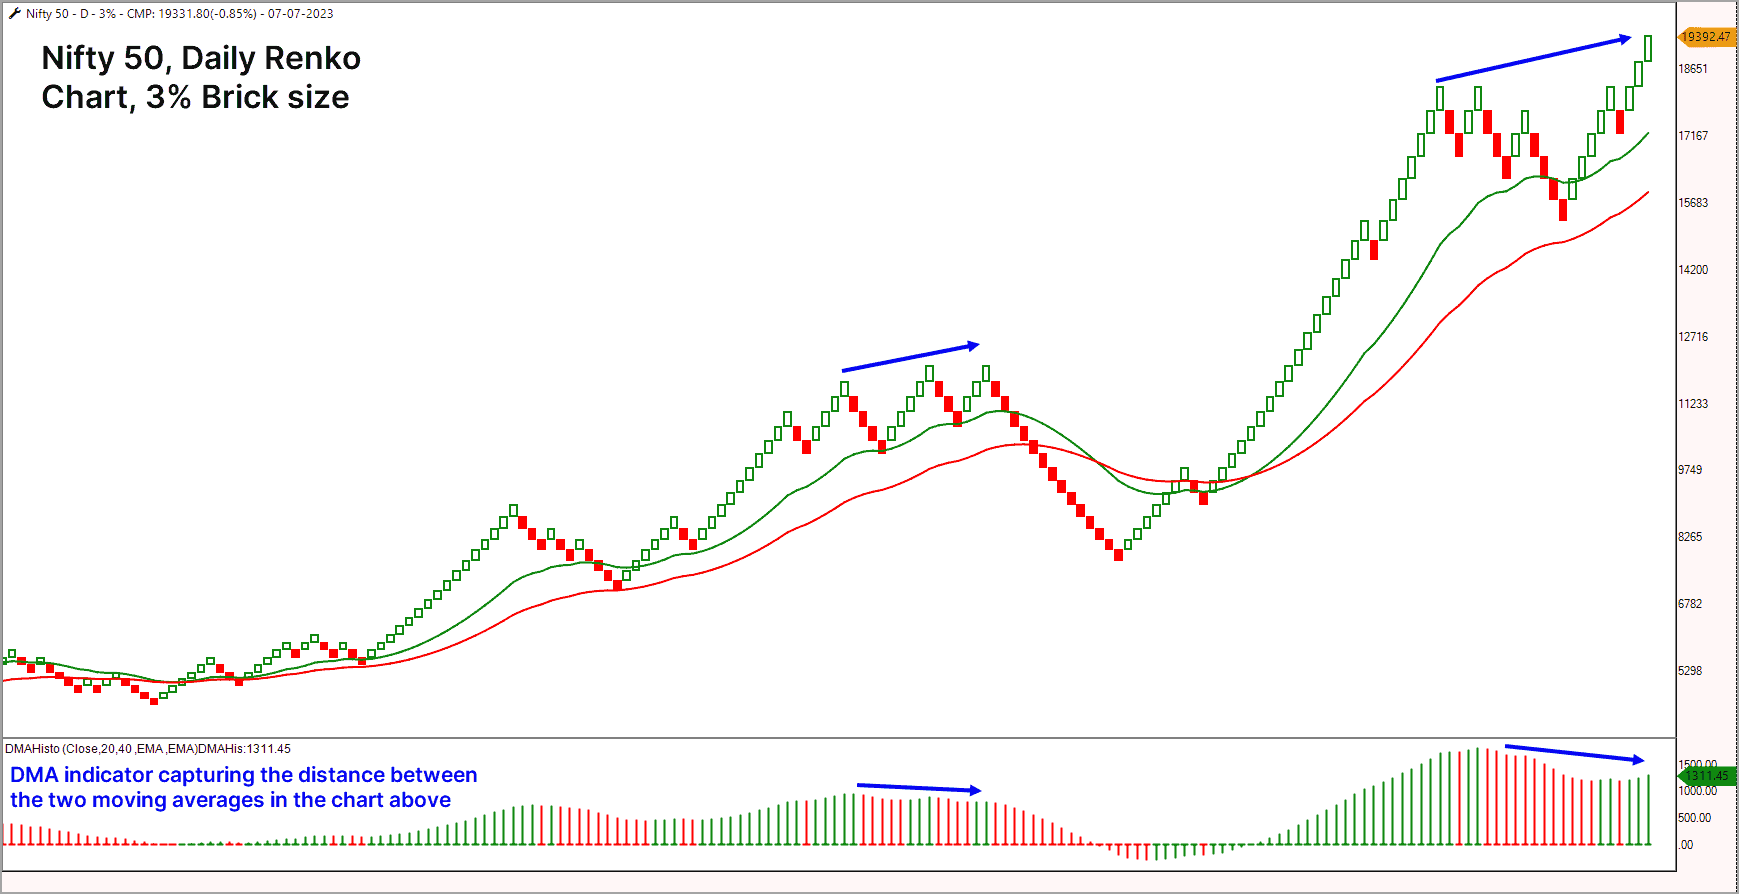
The DMA histogram indicator is plotted in the lower pane in the above chart. This indicator represents the difference between the short-term and long-term moving averages. In essence, this indicator captures the price momentum.
As highlighted in the chart, there is a potential negative divergence, that is still work-in-progress, between the price action and the momentum indicator. We need some meaningful correction in the form of at least a couple of red bricks (roughly 5-6% price correction) to confirm the divergence. It is still a potential danger that one needs to be aware of.
This is a sign that the momentum is waning and normally early signs of weakness manifest in the form of a slowdown or divergence in momentum. But this divergence cannot be the sole reason to expect a turn bearish or empty one’s portfolio.
The idea here is to highlight the red flags so that one does not get carried away by the recent surge in prices. In an ideal world, one should be fully loaded by now, in terms of stock selection and portfolio holding. It is advisable to avoid chasing fresh momentum stocks at this juncture. If you wish to do so, then keep the position size under check and have a tighter risk management policy.
Let us now look at a few sectors. Here again, there are a few interesting developments. Let us begin with the most influential Nifty Bank index.
Nifty Bank Index
As highlighted in the previous update, the Nifty Bank index remains a relative underperformer which is another cause of concern. Banking stocks have a significant weightage and influence on how Nifty 50 index behaves.
Theoretically, the Nifty Bank index can continue to underperform while both indices seek higher levels. This can happen if the Nifty 50 index rises more than the Nifty Bank index. We in fact have been witnessing such a scenario since June 26. This scenario, however, cannot persist for long because it is analogous to driving a vehicle either with an underpowered engine or with constantly dropping fuel reserve.
As highlighted in the previous update, a fall below the 43,000-mark would be an early sign of the onset of a short-term correction in the Nifty Bank index. It would be interesting to watch the price behaviour and the relative performance of this index to get a clue about what is in store for the Nifty 50 index.
Nifty MidSmall Cap 400 index
A very interesting and striking feature of the recent rally in the Nifty 50 index is the participation of the mid and small cap stocks. As highlighted in the previous updates, the breadth indicator for the Nifty MidSmall Cap 400 index has displayed consistent improvement, suggesting buying interest in the broader markets.
This index also almost reached our earlier target of 12,800-13,100. The outlook for the index remains positive as long as the 11,900 level is not breached. There is still a strong possibility of the upper end of the target at 13,100 being achieved.
Other Interesting Sectors
From sectoral indices, the Nifty Auto index continues to shine along with the Nifty FMCG index. We have been highlighting these two sectors as clear standouts in the past few updates and they still remain the bright spots. Here is an interesting chart comparing the relative performance of different sectors in relation to Nifty 50.
The first chart displayed below captures the performance of various sectors since March 28, 2023, when the Nifty 50 index bottomed out.
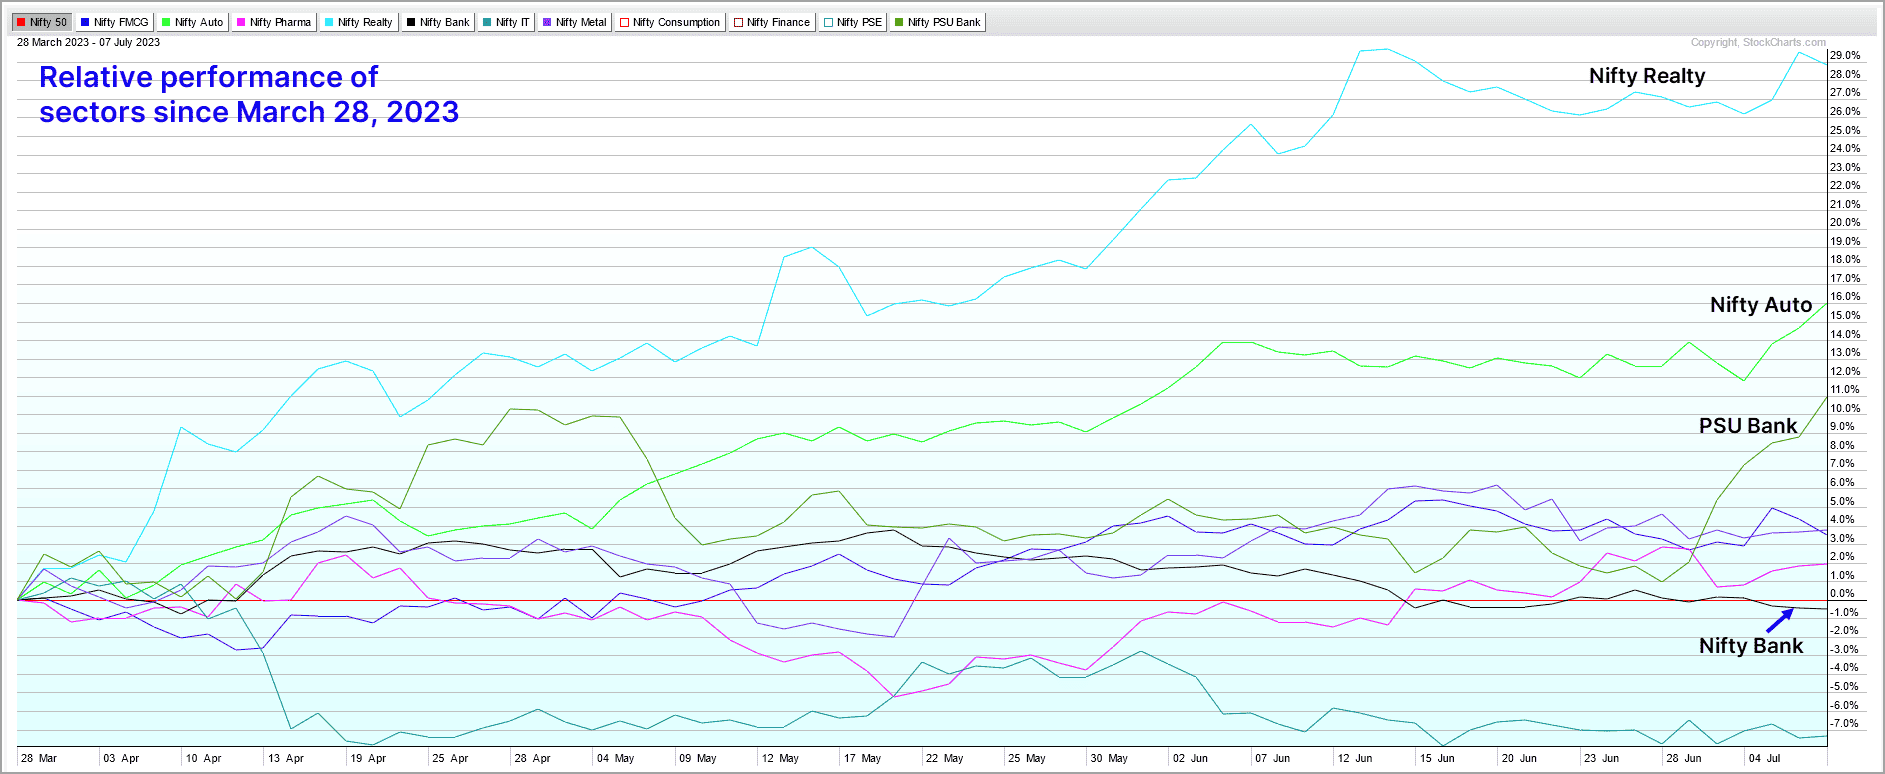
It is apparent from the above chart that the Nifty Realty index has been the star performer in the recent rally. Regular readers would recall that we had highlighted in prior updates about this index showing a lot of promise.
Of course, the Nifty Auto index has also been a stellar performer and it is reflected in the above chart. This sector is positioned below Nifty Realty in terms of relative performance.
While these two sectors are outright bullish, let us also look at some interesting changes that have occurred recently. The most glaring development is the behaviour of the black line in the above chart which represents the relative performance of the Nifty Bank index. The performance line of the Nifty Bank index started sloping downwards since the middle of May, suggesting relative weakness.
And this line, more recently, has dropped below the zero-mark suggesting underperformance versus Nifty 50. On the other hand, the performance of the Nifty PSU Bank index is diametrically opposite. The PSU bank index line has turned up sharply since late June, suggesting outperformance. This index is now ranked third below Realty and Auto. Keep an eye on this sector for some interesting short to medium term buying opportunities.
The Nifty IT index remains an underperformer and it is advisable to stay light on this sector until there are signs of improvement in price action and relative performance. Remember, the Nifty IT index is a proxy for large cap IT stocks. There are a few select small and mid-cap IT stocks that have performed well. It would not hurt to pick a few from that space.
Before winding up, I wish to draw your attention to the performance of the Nifty Pharma index. This index has been a consistent underperformer for several months now. However, have a look at the above chart to study the performance in the past few months. This index was among the top gainers in the month of June 2023.
The ratio line in the above chart is steadily rising since May 19, 2023, suggesting improvement in the relative performance. This ratio line moved above the zero-mark on June 15, 2023, suggesting outperformance against Nifty 50 index. Short-term traders can keep an eye on this sector for short-term trading opportunities if the Nifty 50 index remains bullish.
To sum up, the short-term outlook remains bullish for the Nifty 50 index. But there are growing concerns about the longevity of the rally on account of the red flags listed above. Proceed with caution and enjoy the party until it lasts. As always, have a clearly defined exit plan for your portfolio holdings and remember to execute them if conditions warrant.


3 thoughts on “Technical outlook – Can the Nifty 50 rally continue?”
Hi Krishna,
How to read this in conjunction with VMI market mood indicator: https://www.primeinvestor.in/nifty-vmi-market-mood/
Thanks,
Ravi
The VMI tool takes into account your investment timeframe with a minimum of 1 year, besides the more fundamental metric of PE levels. The levels and indicators mentioned in these reports are from a shorter-term perspective intended to give you an understanding of where markets stand, and where the trends are. – thanks, Bhavana
Good Article !! thanks
Comments are closed.