The author is an external contributor. Views are personal and do not reflect the opinion and views of PrimeInvestor.
We shared a bearish outlook for the markets in the previous update on the Nifty 50 and this view has played out in the recent weeks. The Nifty 50 index breached the important swing low at 23,200 confirming the bearish view.
In this technical update, we shall look at the short-term outlook for the Nifty 50 index along with the mid-cap, small cap, and microcap indices. We will also take a look at a few data points to get some perspective about where we are in terms of the correction. First up, the short-term outlook.
Nifty Short-Term Outlook
In the previous update, we mentioned that breach of the swing low at 23,200 would confirm short term weakness for the Nifty 50 and the index could the head to the target cluster at 22,200-22,600. The Nifty 50 index dropped to a low of 22,930 and closed a bit higher on Friday. Take a look at the Nifty 50 daily chart featured below.
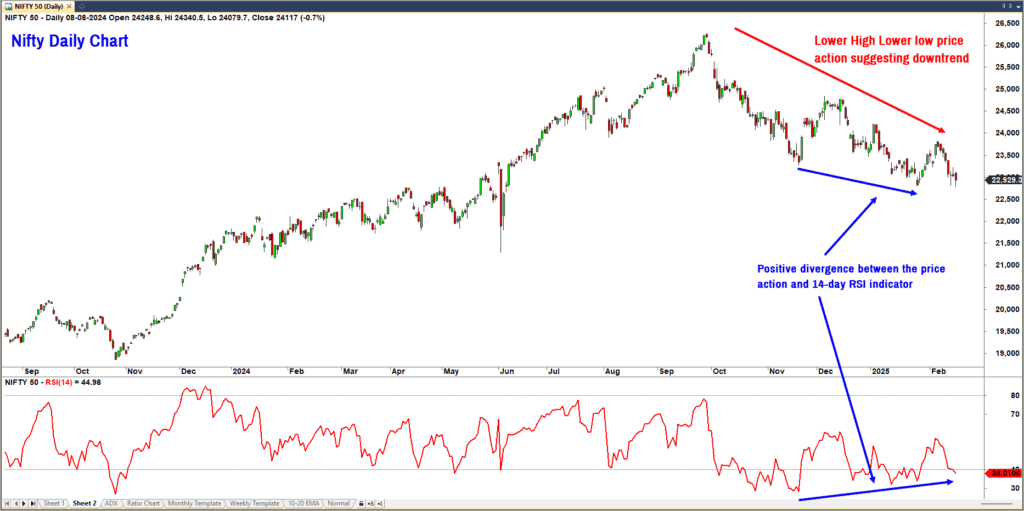
It is evident from the chart that the price is tracing out a bearish sequence of lower highs and lower lows. There is no merit in entertaining bullish thoughts until this sequence is broken. A move above 24,000 would result in a bullish higher high sequence. Therefore, unless we move above 24,000, it would be advisable to remain cautious. As long as the index remains below 24,000 the possibility of a slide to 22,200 or even to 21,600 is not ruled out.
Let us look at a few data points to get a perspective on where we are in the correction cycle from a historical perspective.
Nifty 50 Data Points
A look at the Nifty 50 252-day (1-year) rolling returns since 1995 provides some interesting information. Out of the 7,454 data points since 1995, there were negative returns on 2,172 data points. This means the index has delivered negative returns 29% of the time on a rolling one-year basis.
If we drill down into the negative returns data, the worst performance was a drop of about 56% recorded in Jan 2009, triggered by the global financial crisis. That was probably a one-off or unusual event. Subsequently, there was a drop of about 23% in December 2011 followed by a 21% fall in February 2016 and a 31% slide in March 2020.
We can probably conclude that the worst-case scenario or capitulation threshold is around 23%. Currently, the rolling returns is still positive at 5.4% for the Nifty 50 index, suggesting that there is still room for things to turn uglier.
In this context, we would also like to highlight that a 10% pullback or drawdown in the Nifty 50 index happens in almost all calendar years; we have mentioned this in earlier updates. Until now, the index has witnessed a 6% pull back from the 2025 highs, suggesting that there is room to the downside based on this data point. But remember, this 10% drawdown can also happen later in the year after Nifty probably scales new highs.
To offer some consolation to the bullish camp, it is important to note that the Nifty 50 one-year rolling returns has been positive in 71% of the data points. And a look at the breadth indicators suggest that we are heading towards extreme oversold levels.
Have a look at the weekly chart of the Nifty 50 index featured below. The percentage of stocks trading below their 200-day moving average is featured in the lower pane of the chart.
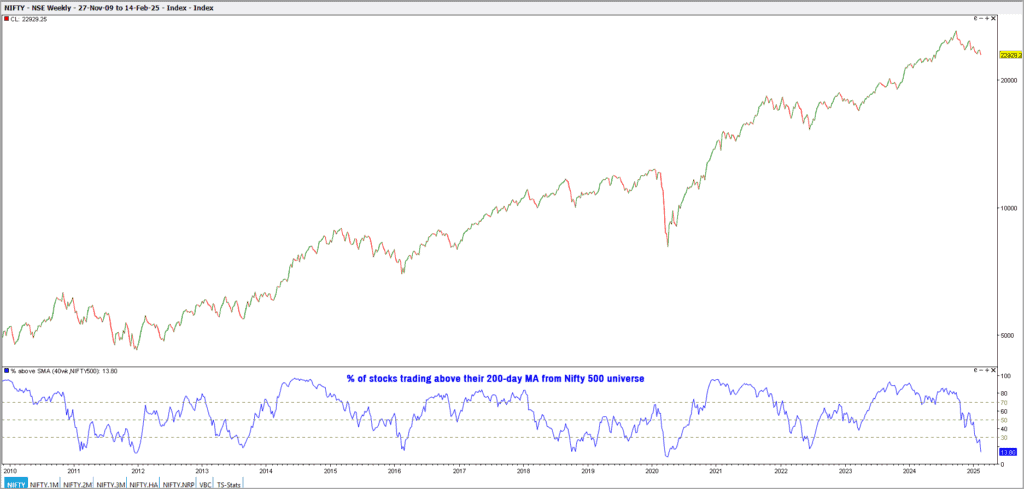
The breadth indicator is at 13.8% suggesting that close to 86% of the stocks are trading below their 200-day moving average. During the crash witnessed in 2008, this breadth indicator dropped to a low of 0.34% in October 2008. During the subsequent fall, this indicator dropped to a low of 12.12% in December 2011 and 15.5% in February 2016. This breadth indicator slipped to 8.25% during the Covid crash in March 2020.
The current breadth indicator reading of 13.8% is not too far away from the historical low of 12%-15% recording earlier. Based on the breadth study, there is a case for a short-term relief rally to play out – but let us not second guess it. A close above 24,000 would be an early sign that the worst is probably over.
To summarize, the breadth indicators are at extreme oversold levels, suggesting the possibility of a short-term relief rally. There a also a positive divergence between the Nifty price action and the 14-day Relative Strength Index (RSI) indicator, supporting the case for a relief rally to pan out.
For now, the expectation is that the index could resume its downtrend to 21,600-22,400 on the completion of the anticipated short-term rally. There is nothing to suggest that the recent downtrend is complete. It would also be important to emphasize that the Nifty 50 index is still underperforming against other asset classes such as gold & bonds.
Therefore, wait for the Nifty to cross 24,000 and more importantly, check if Nifty starts outperforming gold & bonds to confirm a reversal from the bearish trend.
Other indices
Let us now take a quick look at a few other indices. Here is a table capturing the pull back from 52-week highs in major indices.
The Nifty 50 index has dropped 12.7% from its 52-week high. The Nifty MidCap150 index has seen a cut of 18.51% and the SmallCap250 index has seen a much steeper cut of 22.4%. Again the headline numbers do not capture the extent of carnage that has happened to individual stocks or portfolio. Interestingly, the Nifty Bank, Nifty Financial Servies and Nifty IT have managed to outperform Nifty 50 index during this correction.
Nifty MidCap 150 index
This index is a gross underperformer versus Nifty 50 index and the trend is bearish. The index has to move above 20,500 to suggest the possibility of a sustained rally. For now, a slide to 16,700-17,000 is the most likely scenario.
Wait for a clear sign of emergence of an uptrend and more importantly look for signs of relative outperformance of this index against Nifty 50, before committing fresh funds in the midcap stocks.
Nifty SmallCap 250 index
Similar to the midcap index, the Nifty Smallcap index too has been in a strong downtrend and has been underperforming the Nifty 50 index for a while now. There is a possibility of this index dropping to the 13,200-13,500 range. This index has to move above 16,300 to indicate that the worst might be over for small cap stocks. More importantly, wait for signs of relative outperformance of this index versus Nifty 50 before committing fresh funds into the small cap universe.
As always, we will keep you updated based on the unfolding price action and suggest sectors and market segments to focus on, when the tide turns favourable. For now, caution is the buzzword.


4 thoughts on “Technical outlook: Where the Nifty 50 & other indices are headed”
Nifty IT seems to be reversing and to my untrained eye, it looks like the last level is 37300…after that, even that will give up…Infy looks particularly weak. given the large weightage in nifty for IT and the fact that Nasdaq is not very healthy, it looks this will drag the index. Can you pl confirm these levels?
Hi,
After a brief out performance, the Nifty IT index has joined the list of indices that are under performing the Nifty 50 index. The short-term trend is bearish for the IT index and 38,200-38,500 could be a strong support that I would not wish to be breached. As you rightly mentioned, 37,000-37,300 is the next major support. Let us hope that these levels are intact. We will always keep you updated with latest view and levels to watch out for.
Thanks
B.Krishnakumar
with the way, Nvidia and Nasdaq fell overnight, today (4th of March) might be the day, nifty IT cracks 37300 support. Infy has had a weekly/monthly close below 1700 already and looks like it is in C wave downward spiral
Thank you, Krishnakumar for the Caution!