The author is an external contributor. Views are personal and do not reflect the opinion and views of PrimeInvestor.
It was highlighted in the previous update that the trend in the Nifty 50 index is gradually turning bullish. We had also mentioned that a breakout above the 24,000-24,200 range could push the Nifty 50 index to the next target zone of 24,800-25,100.
As anticipated, the index reached the target zone once the resistance at 24,200 was taken out. The price now is at a critical zone wherein the short-term price action would influence the direction of the next big move. Therefore, let us study the short-term outlook for the Nifty 50. We also take a look at a few sectors that are looking bullish, in this report.
Nifty short-term outlook
The breakout above the first resistance zone at 24,000-24,200 is a big positive development from a short-term perspective, as mentioned above. Now, from the daily chart (see below), it is evident that the short-term 50-day moving average is yet to cross the long-term 200-day moving average. This crossover is one of the key elements to confirm reversal of a downtrend.
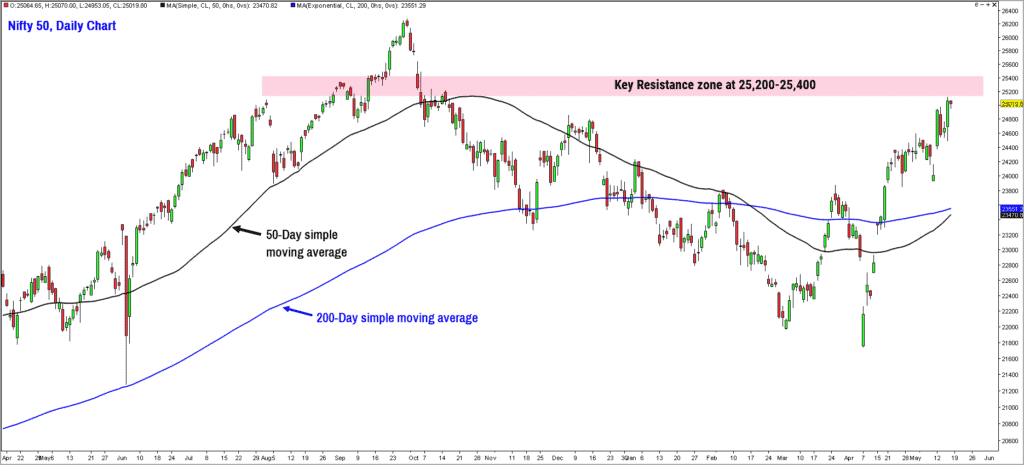
Further, as highlighted in the chart, the Nifty 50 index is now at the next important hurdle which is at 25,200-25,400. A breakout above 25,400 would strengthen the case for the uptrend to sustain and the Nifty 50 index would have enough ammunition to challenge the prior high at 26,300.
Thus, for now, one needs to focus on the short-term behaviour of the index to discern the next directional move. On the downside, support exists at the 23,000-23,500 zone. A decisive breakout either above 25,400 or below 23,000 will set the tone for the next big move.
Let us look at a few other indicators and tools to get a sense of the likely breakout direction.
- The most significant aspect of the recent rally is the participation of the broader markets in the up move. The percentage of stocks trading above their 20-day moving average from the MidSmallCap 400 index has improved from the low of 21% on April 7 to 85% on May 16. This is a short-term breadth indicator, and the dramatic improvement suggests that the majority of the stocks from the universe have turned bullish in the short-term.
- While the short-term breadth indicator is inspiring for the bullish camp, the long-term breadth indicator is still not conclusive enough. The percentage of stocks trading above their 200-day moving average from the MidSmallCap 400 index has improved to 39.5%, but it is yet to cross the 50% mark.
- The other positive development for the equity markets is the sustained improvement in the relative performance of the Nifty 50 index against Nifty Composite G-sec Index as well as gold. In the recent rally, the Nifty 50 index has managed to display outperformance versus the relatively safer asset class such as gold and bonds.
A sustained improvement in the long-term breadth indicator is required to confirm that the tide has turned bullish. For now, the odds are tilted in the favour of the bullish camp, but it would be advisable to wait for confirmation before enhancing equity exposures, especially in the broader markets. Strategic short-term trading or investment bets are totally fine, provided you are adept at it.
Sector outlook
In the previous update, we had highlighted a few sectors that were displaying early signs of promise. The sectors highlighted were Nifty Bank, Nifty Financial Services and Nifty Tourism. We had also highlighted Nifty PSE, PSU Bank and Nifty Defence as the other sectors to focus on.
All of these sectors managed to outperform the Nifty 50 index during the recent rally. While the outlook for all these sectors remains bullish, we shall look at Nifty Defence and Nifty Railways Index.
Nifty Defence Index
This index had displayed early signs of outperformance, and the recent geo-political developments has triggered a distinct positive sentiment towards the sector.
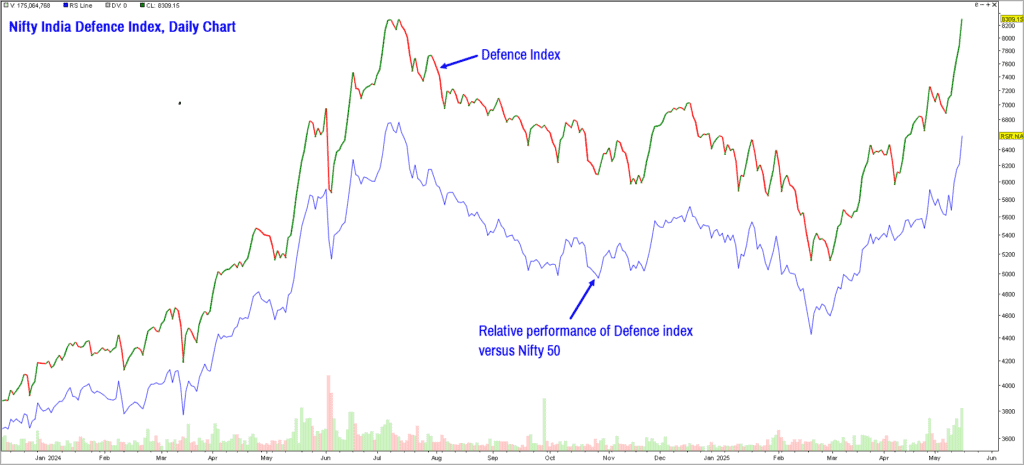
This is another index displaying relative strength in comparison to the Nifty 50 index. The short-term trend is bullish and the Defence index could head to the next target of 9,300-9,600. The positive outlook for this index would be under threat if the price drops below the support level at 7,100-7,200 zone.
Nifty India Railways PSU Index
This index was launched in November 2024 and consists of 16 stocks which are either owned by the Ministry of Railways or cater to the Indian Railways. Here are the top 10 stocks by weight from the index:

This index has been in a downtrend and has underperformed the Nifty 50 index for over six months now. But recent price action suggests that the tide could be turning in favour of this index. After a minor consolidation, the price has completed a breakout, suggesting a move to the next target zone at 4,400-4,700 range.
While there are no conclusive signs of bullishness yet in the Railways index, it is essential to track this sector closely as there is a scope for extremely favourable risk-reward trading or short-term investment opportunities in railway stock. Keep an eye on this sector and any signs of sustained improvement in the Nifty 50 index could have a positive rub off on this sector.
The other sectors displaying early signs of positivity include the likes of Nifty Oil & Gas, Nifty PSE, Nifty FMCG and Nifty Auto are setting up well. Watch these sectors for investment or trading bets if the bullish trend sustains in the Nifty 50 index.
To summarize, there are a few positive technical developments from a short-term perspective. And the minimum upside potential, based on this short-term bullishness, has been achieved. One however needs to watch out for a sustained improvement in the long-term breadth indicator of broader markets and a crossover of the short-term moving average above the long-term moving average before turning bullish from a medium-term perspective. The message here is to be cautious and selectively bullish in equity markets as long as 23,000 is not breached.


2 thoughts on “Technical outlook: Short-term trends in the Nifty 50”
Very logical prediction as always. I am unable to see the current level of Nifty India Railway Index in the NSE site or anywhere else. Could you let me know where is this index level seeable?
Hello:
Thanks for the feedback. There are a few indices offered by the National Stock Exchange, wherein the values are not calculated / disseminated on a live basis. For such indices, one has to download the data from the official website and study the charts. Nifty India Railways Index falls into this category where live rates are not available. Only option is to source the data from NSE website and maintain the data for study.
None of the real-time data providers including the likes of TradingView are unlikely to offer data for indices which is not calculated on a live basis.
Hope this helps.
B.Krishnakumar
Comments are closed.