The author is an external contributor. Views are personal and do not reflect the opinion and views of PrimeInvestor.
We shared a bearish outlook for the markets in the previous update on the Nifty 50, and had mentioned that the Nifty 50 index could slide to 21,600. The bearish trend prevailed, and the index dropped to a low of 21,900.
But since this level, the Nifty 50 has been in a recovery mode in the past few weeks. So the key question now will be – Is the worst over for equity markets? And the attendant question, should one increase exposure to equity markets?
In this update on the Nifty 50, we shall address these points. We will look at the Nifty 50 short term price chart along with the relative performance of Nifty 50 versus gold and Nifty G-Sec Composite index to answer the above questions.
Nifty Short-Term Outlook
In the prior updates, we mentioned that the Nifty 50 index must move above 24,000 to invalidate the bearish sequence of lower highs and lower lows. Have a look at the Nifty Daily chart featured below.
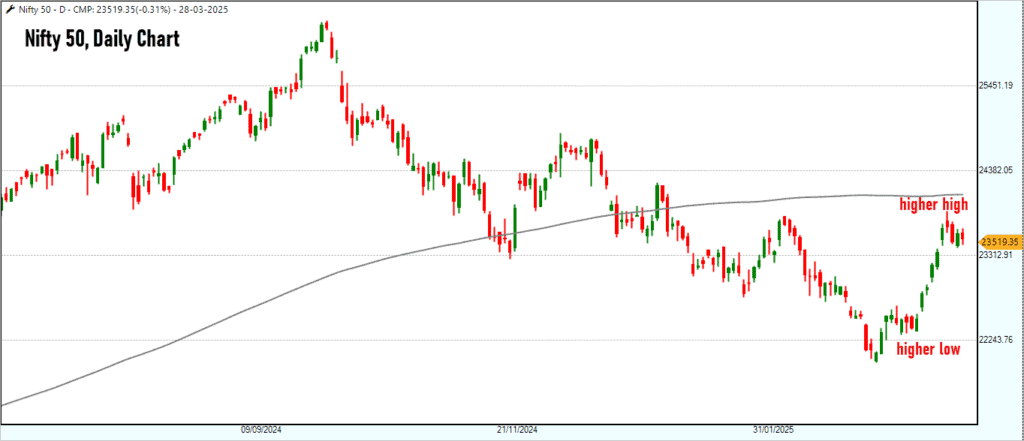
Though there is a bullish sequence of higher highs and higher lows visible in the recent recovery, it would still be prudent to wait for a close above 24,000 for additional confirmation. A breakout above the level of 24,000 would push the Nifty 50 index above the prior swing high recorded during the downtrend. A breakout above this swing high is essential to indicate that the recent low at 21,900 is a significant one. As highlighted in the previous prior update, unless we move above 24,000, it would be advisable to remain cautious.
Let us also look at the breadth data to assess the quality of the recent rally:
- The percentage of stocks from the Nifty 500 universe that are trading above their 200-day moving average, has improved from a low of 9% in late February to the current level of 21%. This is a healthy sign suggesting that the recovery has percolated to broader markets too. The percentage of stocks trading above their 200-day moving average is a long-term breadth indicator and ideally this indicator should at least cross the 50% threshold to turn bullish.
- Let us also look at a short-term breadth indicator – the PF-X% breadth indicator, a reliable indicator that we have often discussed. This indicator captures the percentage of stocks that are in a bullish swing from the chosen universe. The PF-X% indicator for the Nifty 50 basket reached the overbought zone a few days ago and suggests the need for a cool off or pull back in the short-term.
The level of 22,400-22,500 is a key support zone for Nifty 50. A breach of this zone will be the first indication that the worst is probably not over yet for equity markets. A breach of the recent low of 21,900 would be a sign that the Nifty could seek much lower levels.
For now, we will have to play the waiting game. The Nifty 50 index has achieved the minimum pull back criteria for a bounce from an extreme oversold zone. Presently, the odds are ever so slightly tipped in the favour of the bullish camp. But let us wait for a decisive breakout above 24,000 and monitor the behaviour of the long-term breadth indicator before getting too excited.
As always, we will update you with upside or downside targets if the levels mentioned above are breached. For now, above 24,000, a push to 24,950-25,250 can materialize. Let us discuss downside targets if 22,400 is breached.
Nifty 50 vs Comex Gold
Gold has been a stark outperformer since January 2024. The yellow metal has yielded returns more than 50% during this period and Comex gold prices have also hit our target price of $3,100 mentioned in earlier updates.
The Nifty 50 index remains a relative underperformer in relation to Comex gold. Though there are early signs of outperformance in the past few weeks, the overall trend in the ratio chart of these two instruments is still bearish, suggesting underperformance of Nifty 50.
Keep an eye on this ratio chart to assess the relative performance. Any signs of sustained outperformance of the Nifty 50 would be an early sign of enhancing exposure to equity markets. For now, there is no so such concrete signs yet. So, better to be in the cautionary, wait-and-watch mode.
For those who are aggressive, you may put some money to work in equity markets if the Nifty 50 index pulls back to 22,500-22,600 zone, with a caveat that these exposures should be trimmed if the index drops below 21,900.
Nifty 50 vs Nifty G-Sec Composite Index
Nifty Composite G-sec Index is constructed using the prices of top 10 (in terms of traded value) liquid Government of India bonds with residual maturity greater than 1 year and having outstanding issuance more than Rs. 5000 crores.
This is an index that is offered by the National Stock Exchange and can be considered as a proxy for debt market returns. A look at the relative performance of this index versus Nifty 50 suggests that the equity markets have been underperforming debt markets since September 2024.
There are still no signs of a reversal of this relative underperformance of the equity markets. Though there are green-shoots visible during the recent recovery off early March lows, it is too early to proclaim that Nifty 50 has ended its underperformance.
US Dollar Index
Before we wrap up, let us also study another important factor which plays a key role in influencing the behaviour of the equity markets. The factor in question is the US Dollar Index. Have a look at the relative performance chart Nifty 50 index versus the Dollar index featured below.
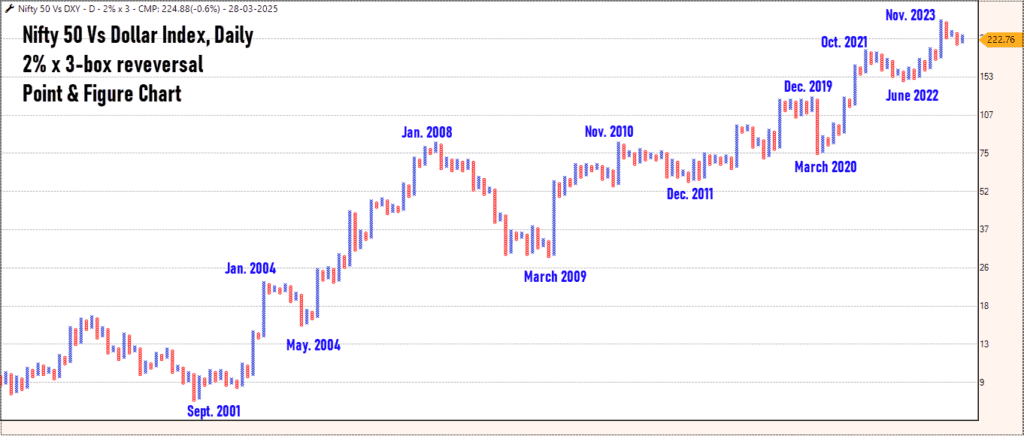
Notice how this chart captures the major inflexion points in the Nifty 50 index, including the recent peak recorded in late 2024. Currently we are in a column of X, coinciding with the recovery witnessed from early March 2025. Keep a track of this chart and wait for signals of outperformance of Nifty 50 versus the dollar index.
Summary: To summarize, there are green shoots suggesting short-term positivity for equity markets. But it is too premature to conclude that the worst is behind us. The behaviour of the Nifty 50 index in the short-term, along with the movement in the breadth indicators and relative performance versus other asset classes would provide further insights about what is in store for the equity markets. Remember, there is no rush to increase exposures to equity markets. Nothing wrong with waiting for confirmation, even if it means an exposure at slightly higher levels.


2 thoughts on “Technical outlook: Is the Nifty 50 on the recovery path?”
Very nicely summarised once again. I look forward to these update before thinking of increasing exposure to the markets in my personal portfolio and it also serves as a guidance for our clients too. Thanks to Prime investor team as well
Hello:
Thanks a lot for the feedback. Glad that you find it informative.
B.Krishnakumar
Comments are closed.