The author is an external contributor. Views are personal and do not reflect the opinion and views of PrimeInvestor.
We had warned in the previous update on the Nifty 50 about the possibility of a spike in volatility in the markets based on historical data and breadth analysis. The price action panned out in sync with this expectation and the benchmark indices had a mad rush up and an equally sharp cut lower in the past few weeks.

After edging past the upper boundary of 25,500, the Nifty 50 index did a U-turn and dropped 5.45% from the highs. More than the damage to the Nifty 50 index, what was more glaring was the sharp cut witnessed in stocks from the broader market. The rally witnessed prior to the recent fall was more or less confined to the Nifty 100 universe while the broader market continues to remain sluggish. Let us discuss the short-term outlook for the Nifty 50 index and a few of the sectoral indices.
Nifty Short-Term Outlook
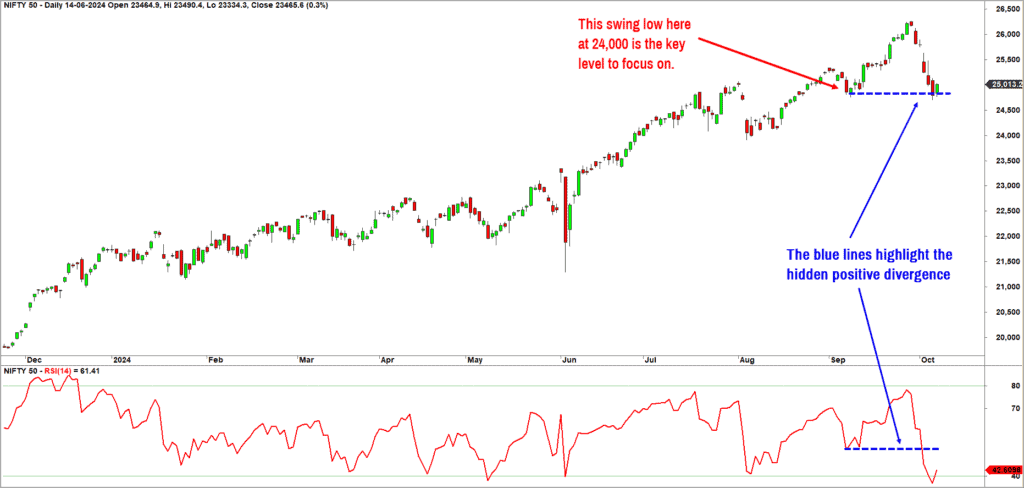
Here is the daily chart of the Nifty 50 index. In the previous update we had pointed out the classic negative divergence that was evident in the Nifty 50 chart and its 14-day Relative Strength Index (RSI) indicator. What we wish to highlight now is a classic hidden positive divergence.

As highlighted in the above chart, the price just edged below the prior low and turned higher on Tuesday. But the 14-day RSI indicator has decisively broken the corresponding low and has turned higher now. This is a classic hidden positive divergence hinting at the possibility of more upside in the short-term.
Apart from this positive divergence, the breadth indicators too have hit the oversold zone, supporting the possibility of a short-term bounce. The immediate target-cum-resistance zone for the Nifty 50 is in the 25,300-25,500 range. But a close below 24,000 would indicate that the index is headed into a deeper corrective phase. As long as this level holds, there is an outside chance of the index trying to scale fresh highs.
But we consider this as a less likely scenario.
We do not see significant upside potential and the expectation for now is a continuation of the downtrend on the completion of the anticipated short-term uptrend. This is a tentative view and as always, we shall keep you updated based on the unfolding price action. The breadth in the higher time frames is still overbought or have just receded from overbought zone.
Hence there still is a higher probability of a time-wise or price-wise correction to unfold rather than the possibility of a continued rally.
Nifty SmallCap 250
After a glimpse of recovery, this index was among the worst hit during the recent fall. This index lost about 6% from the recent highs in comparison to the Nifty 50’s fall of 5.45%. We have been consistently highlighting the relative underperformane of this index and of the broader markets for a while now. There is no change in this behaviour and much of the action is still confined to the large cap names.
As mentioned in previous updates, the swing low of 16,700 is the key level to pay attention to. A breach of 16,700 would be a major sign of weakness.
Similar to the Nifty, we anticipate a minor pullback to the upside followed by another leg of decline. The immediate upside potential for this index extends up to the 18,200-18,600 range.
A close below 16,700 would be a major sign of weakness and could open up further downside targets extending up to 14,800-15,000. Also keep an eye on the relative performance of this index versus Nifty to ensure that this index that this index is outperforming. Be selective and stock specific and look for short-term swing trading opportunities within the small cap space.
Sector indices
Now, let’s shift focus to some of main sector indices.
Nifty Bank index
This index played a key role in propelling the Nifty 50 index to higher levels in September. And the recent fall was also spearheaded by this index. Broadly, the Nifty Bank Index is yet to display any concrete signs of relative outperformance versus Nifty 50.
But similar to the Nifty 50 index, the bank index too could see a short-term rally, extending up to 52,800-53,500. This index at best could be a trading bet from the short-term term. A drop below 49,700 would be a major sign of weakness.
Nifty Pharma
We have been bullish on this index for a while now and this index has turned out to be a star performer. This index almost reached our latest target of 23,800-24,000.
At the moment, though, the index is overbought from a medium to long term perspective. We would therefore not recommend fresh exposures in the pharma index at this juncture. Let the price cool off or get into a consolidation to address the overbought condition. A fall below 22,500 would be an early sign of the possibility of a deeper price-wise correction in this index. Until this level is intact, one may remain invested in the pharma space.
Nifty IT Index
Along with the pharma index, we have been voicing a bullish outlook for this index too in our recent updates. As observed in the previous update, we still maintain that the IT index can head to the target of 44,500-45,500. This view would be under threat if the index falls below 38,400.
This index has managed to weather the storm and has got away with minimal damage during the recent fall in the major indices. The short-term outlook is bullish for this index and one can look for exposure in select large and mid-cap IT stocks.
To sum up, the Nifty 50 index is likely to witness a short-term pull back rally. Whether this anticipated rally would be strong enough to propel the markets to new highs is something that is too early to speculate. As emphasised in the recent updates, be cautious and extremely selective in picking stocks. Look for stock / sector specific opportunities and take strategic short to medium term bets. This is probably not the time to make big lump sum allocation in the market.


3 thoughts on “Technical outlook – can the Nifty 50 rally now?”
Thanks very much sir 🙏💐🙂
Hi Krishna Sir, any updates on gold and silver pls?
Hello Srikanth:
Both Gold & Silver are bullish. Gold is at all time highs while silver recorded a new multi year high last week. I am bullish on both with marginal overweight on gold. The gold silver ratio chart is still in favour of gold meaning the yellow metal is still outperforming silver. Keep on eye on the ratio chart to assess if silver is gaining more traction. If so, then increase allocation to the white metal.
As far as Nifty 50 versus Comex gold performance is concerned, gold has recently outperformed Nifty. For now, gold has an upper hand. My short-term target for comex gold is north of US$3,000. And for comex silver am looking at the possibility of a move to US $39.
Regular readers may recall that we have been sounding cautious about the equity markets and also warned about the possibility of a spike in volatility which is playing out.
Hope this helps!
B.Krishnakumar
Comments are closed.