Starting now, we will be writing a series on what’s cooking with macro indicators and how they affect us as investors. The first of this Prime Macros series is on India’s recent Q2 FY26 GDP numbers.
With AI assistants to help out, the latest GDP release from NSO (National Statistics Office) has triggered an explosion of social media posts. Some praise them, some diss them and some claim that India’s GDP data is of no use because it is cooked up! But what useful information can we take away, from the latest GDP data? We try and answer top-of-mind questions that investors are likely to have.

Q Is 8.2% growth for real?
Yes, NSO’s latest data shows that India did manage 8.2% real GDP growth in Q2 FY26. This was partly thanks to a low-base effect. In Q2 FY25, India’s real GDP growth had grown only by 5.6% due to the hangover from general elections, which paused economic activity.
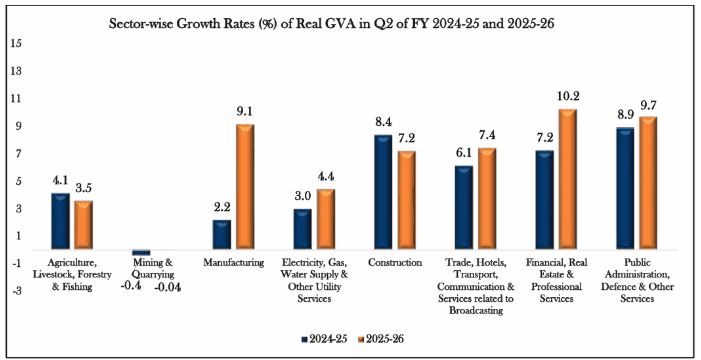
Breaking down the numbers, manufacturing, which has belted out 9.1% growth in GVA (Gross Value Added) in Q2 FY26 was the biggest beneficiary of this base effect, as you can see from the graph below. The low base effect was also in play in capital expenditure. In H1 FY25 the government had met only 42% of its full year capex targets; in H1 FY26 it achieved 52%. The 10.2% expansion in financial, real estate and professional services has also been partly helped by a low base effect. But most other sectors grew without the help of the low base effect.
After factoring in last year’s low base, forecasters projected that India’s real GDP will grow by 6.8%-7.3% this quarter. But it actually grew by 8.2%, surprising them and forcing them to upgrade their estimates. This shows that the growth cannot be entirely written off as the effect of a low base.
Q Then why don’t we feel as if the economy is growing fast?
Real GDP growth is what economists track. But it is nominal growth which reflects in our incomes and corporate toplines.
While real GDP growth in Q2 FY26 was the highest in six quarters, nominal growth was the second lowest in eighteen quarters at just 8.7% (See table below). The Indian economy needs nominal growth to return to its normal levels of 12-13% for households to feel their incomes are growing. Nominal growth is also essential for the government to meet its fiscal deficit targets and keep its debt within check (as nominal GDP is the denominator to deficit and debt calculations).
A sector-wise breakup shows that while real growth was broad-based, nominal growth was patchy in Q2. Agriculture, mining, utilities, construction and trade/hotels/communications are the key sectors where pricing pressures are evident.
Agri product prices are likely to remain muted in the coming months, given the surplus South-West monsoon and good kharif and rabi crops. Therefore, it remains to be seen if sectors such as mining, construction, trade/hotels etc regain their pricing power.
Q What’s happening to consumption? Has capex picked up?
Diving into the expenditure side of the GDP, consumption (PFCE) is in good shape growing at 7.9% in Q2. Mind you, this is without factoring in GST cuts, which kicked in only from September 22nd 2025. As the month before GST cuts saw consumers postponing their big-ticket purchases, over 7% PFCE growth is very healthy.
Government revenue expenses (GFCE) shrinking by 2.7 per cent this quarters is a good thing, as it shows that the government is being frugal with its salaries, wages, subsidies and so on. Slow nominal growth and personal tax/GST cuts mean that the Centre will struggle to meet its deficit targets this year. Therefore, if it is cutting back unproductive expenditure as a precaution, that’s a good thing.
GFCF growth, which shows capital spending by the government and private players doesn’t look too great at just 7.3% – lower than Q1. As the government has sharply increased capital spending in H1, sluggish corporate capex seems to be the villain.
Q If we are managing 8% plus growth despite Trump tariffs, maybe the trade deal doesn’t matter?
It does matter. Exports chip in with about 21-22% of India’s GDP, but imports account for 25%, dragging down GDP
GDP= C+I+G+(X-M)
C= Private consumption or householding spending on goods and services
I = Private Investment (both business spending and household spending on new housing)
G = Government spending on goods and services (excluding transfer payments like pension)
X = Export of goods and services
M = Import of goods and services
Therefore, for India’s GDP to expand export growth needs to counteract import growth. In the first half of FY26, despite Trump tariffs, India’s exports expanded by about 5.5%. Government data suggests that while goods exports grew by 3% in H1 FY26, services exports grew over 6%. This helped counteract imports which grew by 3.5%.
But this happy situation may not last. The month of September saw export growth slow to less than 1% while imports expanded 11.2%. (Refer data here). Note that Trump’s penal tariffs of 50% on India kicked in from August 27. Therefore, Indian exports have begun to feel the heat only from September.
Q If GDP growth is reviving, does this mean earnings growth will also revive?
Theoretically yes, higher economic activity should lead to higher corporate profit growth. However, history shows that the relationship between GDP growth (whether real or nominal) and corporate earnings in India is not linear.
The table below shows that listed companies achieved differing levels of sales, EBIDTA and profit growth, at similar levels of GDP growth. This is because the composition of the Indian listed space varies quite a lot from that of the economy.
While GDP has a 15% contribution from agriculture, 59% from services and 26% from industry, the listed universe is overweight in industry and underweight in services. However, a revival in manufacturing can trigger an earnings revival. It is perhaps due to this that India Inc’s topline and EBIDTA growth saw a pickup in Q2 FY26 compared to the preceding quarters.
Q Can India’s GDP numbers be believed? We read so much about the low deflator and high discrepancies.
India’s GDP measurements do carry imperfections due to the large informal economy, the use of an old base year (2011-12) and the use of dated CPI and WPI data as deflators to GDP.
However, India follows standard methods of GDP measurement followed by other countries. Global agencies such as IMF and World Bank rely on the NSO’s estimates for their own assessment of the Indian economy.
Even if we are sceptical about this, as investors we need to be concerned mainly with the trends in GDP over time. These are reliable, because the measurement methods used are the same over time. India reported a 5.8% contraction in GDP in FY21 due to Covid using the same deflator and base year. Therefore, conspiracy theories that the numbers are “cooked up” to look good, don’t hold any water.
If you are interested in the deflator and the mysterious ‘discrepancies’ you can read my Linkedin post here.


4 thoughts on “Prime Macros: Six investor takeaways from the GDP numbers ”
Interesting read and a good insight.
Thank you
Interesting analysis. Regarding achieving Nominal GDP growth > 12%, given that we would like to keep inflation at around 3%, should Real GDP Growth be > 9% ? And in order to achieve this, should the underperforming sectors such as Agriculture, Mining and Construction show higher Real growth and what will drive this?
Thank you. I think real growth beyond 8% is very tough. Normal inflation rates in Inda are at 5% plus so that’s where the nominal growth must come from. 3% is tough to achieve on a durable basis