While the benchmark Nifty 50 index has been confined to a broad trading range, the broader markets or the mid-and-smallcap index and universe have been buzzing with action. So let’s move away from the Nifty 50 and look at the other sharply rallying market segments. More specifically, let’s look to the current trend and the near-term outlook for the Nifty MidSmallcap 400 Index. We have covered this index in an earlier article. We take a relook now.

Nifty MidSmallcap 400 outperformance
Here is the ratio chart of this index versus the Nifty 50 index, plotted in the Point & Figure format. It is apparent from the chart that the Nifty MidSmallcap 400 Index has been a big outperformer since November 2020.
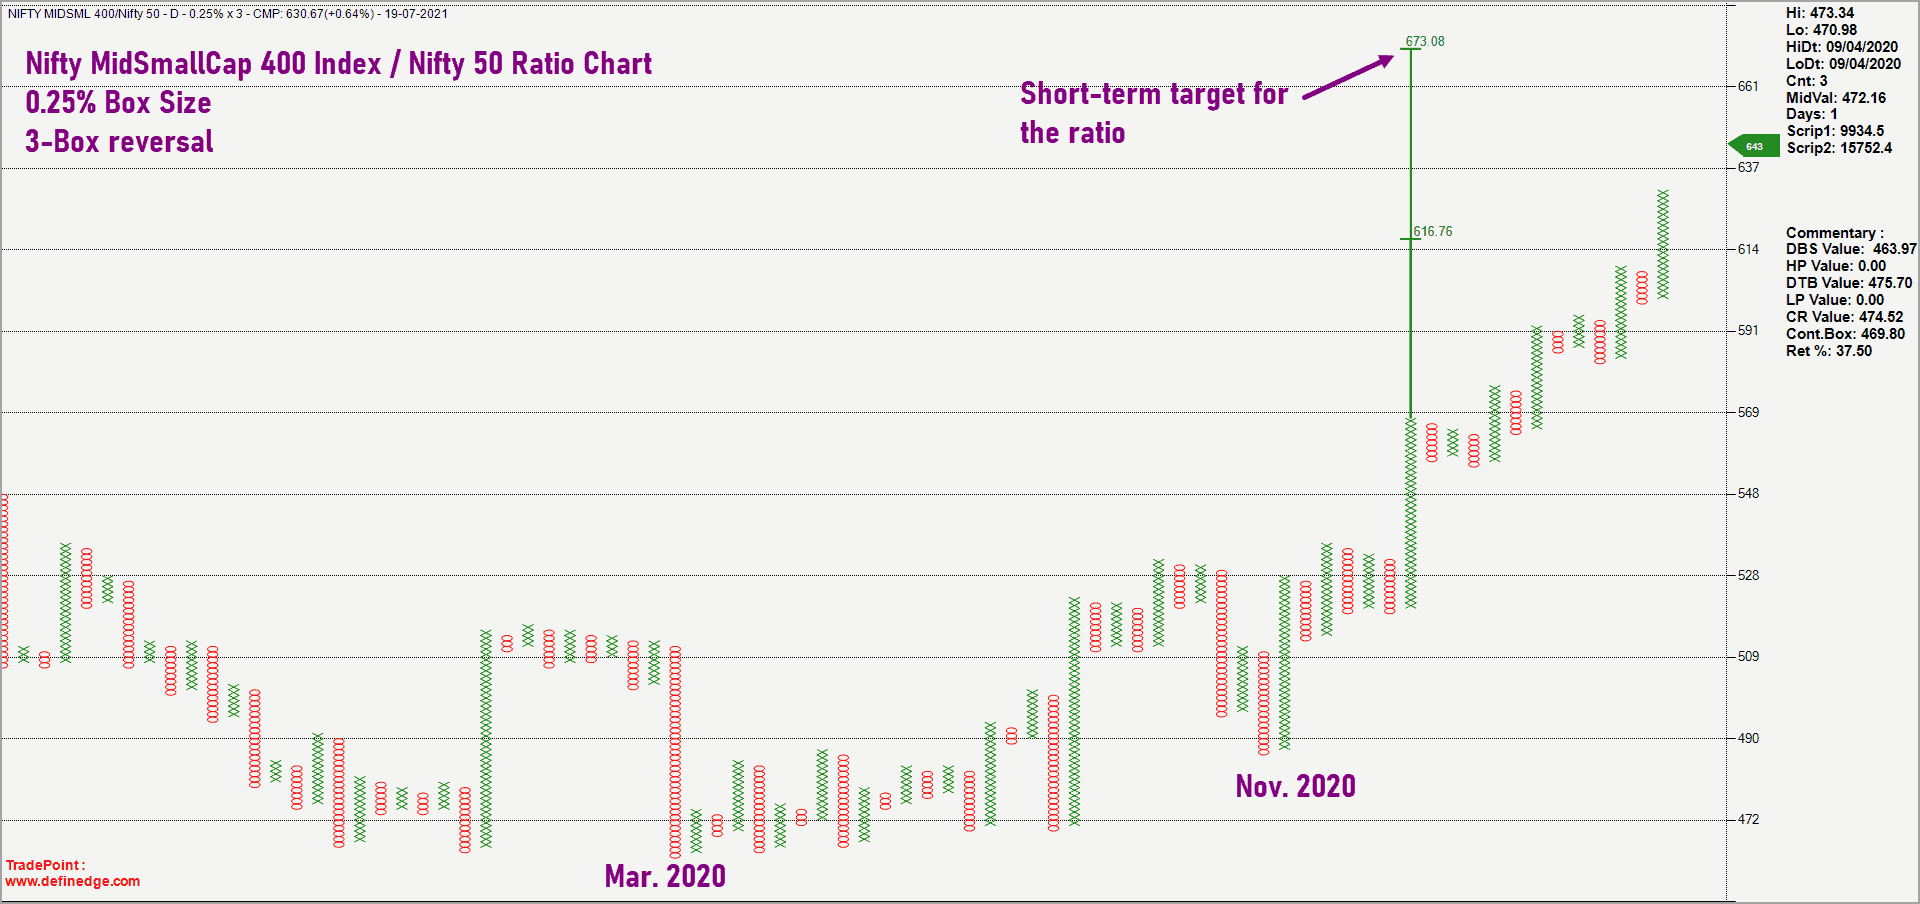
The series of higher highs and higher low patterns in the ratio chart is a clear sign of bullishness and outperformance. The vertical count target for this ratio chart is 673 which represents a 6% upside from the current levels. This indicates the scope for the outperformance to continue in the near term.
Now, have a look at the chart of the Nifty MidSmallcap 400 Index featured below. The index is now within striking distance of the target of 10,081 that we had mentioned in our previous coverage of the index. Here is the updated chart of the Nifty MidSmallcap 400 Index.
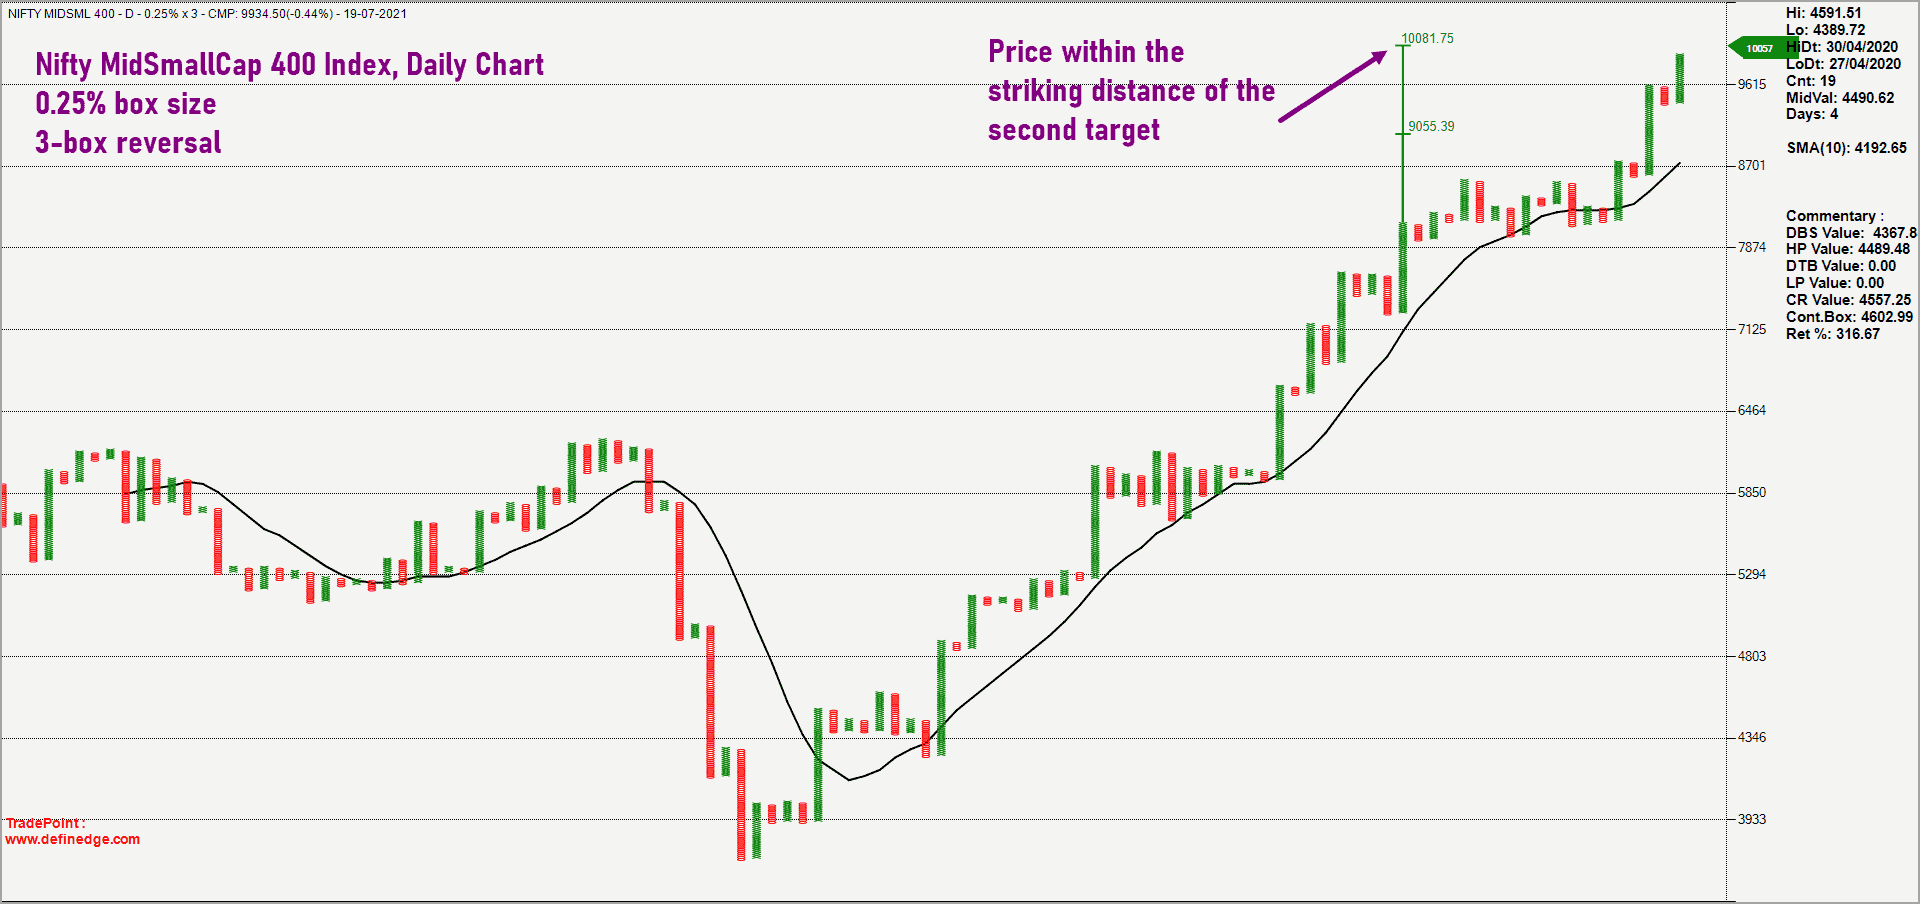
It is apparent from the above chart as well that the trend in Nifty MidSmallcap 400 Index is bullish. A look at the relative strength and the price chart together suggests that there is no reason to suspect any reversal or threat for the Nifty MidSmallcap 400 Index index.

Possible red flags
But running a check on any probable red flag that can impact this trend is prudent at this time. To that end, here’s a quick look at the short-term breadth indicator of this index. The chart below shows the daily chart of Nifty MidSmallcap 400 Index along with the percentage of stocks trading above their 50-day moving average.
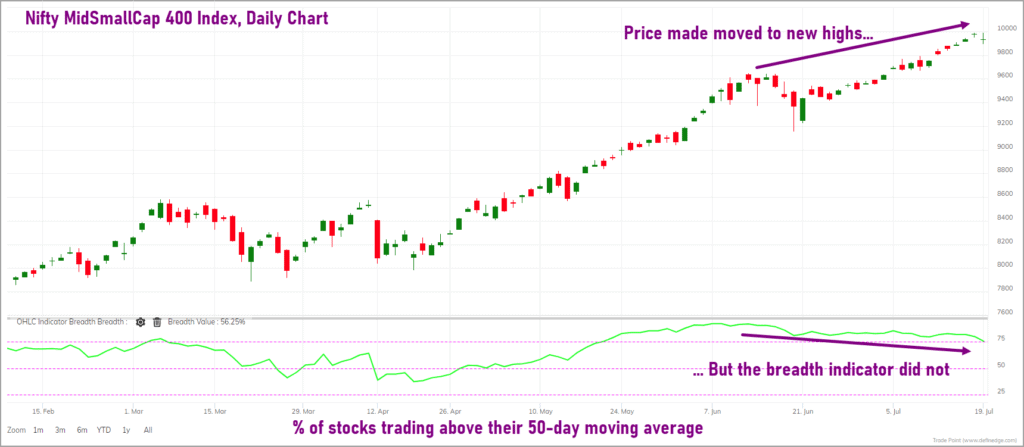
In the chart above, the short-term breadth indicator is plotted in the lower pane. The percentage of stocks trading above their 50-day moving average is used as the breadth indicator.
From the chart, it is evident that the index price has made fresh highs, but the breadth indicator has not. This is a classic negative divergence, suggesting that the recent rise in the index is not accompanied by broader participation of stocks from the universe. In the earlier leg of the uptrend from April 12, 2021, the rise in the index was backed by improvement in the breadth indicator as well.
But now, there is a negative divergence between the price action and the breadth indicator. There are two ways to interpret this divergence.
Preferred scenario
The first and logical interpretation is that this divergence is a red flag, and it makes sense to avoid fresh aggressive exposures in this universe. Remain invested with the existing exposure in the mid & small-cap stocks but keep your exit plan handy to be executed if the need arises.
When such a negative divergence is visible, there is a strong possibility of a potential trend reversal or at least a consolidation. What is essential to monitor in this scenario is the relative performance of this index versus Nifty 50. And what is even more important is the trend in the Nifty 50 index.
If the Nifty 50 index gets into a correction and if this triggers an underperformance in Nifty MidSmall Cap 400 index, then it would be a strong sign to lighten exposures to the broader market.
Alternate Scenario
The other way to interpret this divergence in breadth indicator is to consider this cool off in breadth as a proxy for rotation within the Nifty MidSmallcap 400 Index constituents. This alternate view would be relevant if the breadth indicator sustains above the 50% mark. The indicator is currently at 75.5%.
There is nothing to worry about the Nifty MidSmallCap 400 index if it sustains above the recent swing low of 9,000. If the price holds above 9,000 and the breadth indicator sustains above the 50% mark, then there is a strong case for the index to continue its outperformance and scale fresh highs.

Conclusion
For now, it would be advisable to play it safe and await clarity. Exposure to the mid and small cap space may be increased only if there is evidence to suggest that the second scenario is playing out. Until then, remain cautious and have an exit plan for existing holdings handy. But do not exit holdings in a hurry. If the benchmark Nifty 50 were to correct, check the relative performance of Nifty MidSmall Cap 400 index versus Nifty 50. If there is underperformance when Nifty 50 corrects, then look to reduce exposures.
The key takeaways are:
- The divergence between the price action and breadth is a cause of concern. Hence, avoid aggressive fresh exposures in the mid and small cap space.
- There is no reason to panic-sell existing holdings in the mid and small cap universe. However, have an exit plan and be ready to execute it if there is a correction in the broader markets, triggered by the weakness in the Nifty 50 index.
- A close below 9,000 would be the first major bearish sign which would warrant execution of your exit plan. Until then, remain invested but avoid any major fresh exposures in this space.
We will soon come up with an update when there is more clarity on which scenario is playing out.


8 thoughts on “Can the rally continue in the mid-and-smallcap index?”
Hi sir,
Am a beginner, and have a few doubts.
1. cool off in breadth as a proxy for rotation within the Nifty MidSmallcap 400 Index constituents, by this, do you mean that the stocks that dint participate in the previous rally are now participating in it?
2. When the bull market cools off, what is the general percentage of stocks that keep trading above 50 day average, or is this data point irrelevant in a non bull and bear market.
Thanks
Devang
Hello Devang:
1. A cool off in breadth can happen due to profit booking in stocks that have rallied earlier. If this scenario plays out, then the breadth would cool off but typically sustain above the 50% mark. This means more than half of the index constituents are still bullish as they are trading above their 50-day moving average. While the stocks that rallied may cool off, for the breadth to sustain above 50% and / or improve, the other stocks must remain bullish. This is what I meant by rotation.
What I mentioned above is just a bullish case scenario or possibility.
2. When the bull market cools off, the ideal setting is for the breadth to drop to levels below 25 and then recover. This indicates that there is a nice correction and the scenario is ideal for a fresh leg of the rally. But, monitoring breadth indicator alone is not sufficient. Also keep an eye on the relative performance of the mid small cap index versus Nifty 50. A breadth cool off with the out-performance being intact is the ideal scenario to initiate fresh aggressive exposure in the broader markets.
Hope this helps.
B.Krishnakumar
Is it still okay to do SIP?
Hello:
You can continue with the SIPs. Personally, I would stop those SIPs only if I see signs of this index under-performing the Nifty 50 Index. For now, there is no such indication yet.
You can also consult your financial advisor / Financial planner for further course of action.
Regards
B.Krishnakumar
Hello, I am subscriber but am not able to access the article:
https://www.primeinvestor.in/rally-in-the-mid-and-smallcap-index/?utm_source=sendinblue&utm_campaign=PostJul212021&utm_medium=email
Ghanshyam Parsram
[email protected]
This article is available to our Growth subscribers. So if you have an Essentials subscription, you won’t be able to access the article. You can upgrade to the Growth plan, if you wish to. – thanks, Bhavana
Hi, I just subscribed this morning by paying Rs.2,500. I am unable to read the full article on the mid and small cap rally possibility. When I click on read more, it is asking me to subscribe or log in. Please advise.
This article is available to our Growth subscribers. If you have subscribed to the Essentials plan, you won’t be able to access the article. You can upgrade to the Growth plan, if you wish to. – thanks, Bhavana
Comments are closed.