Mirae Asset AMC is developing a passive offering that’s different from other AMCs. A new NFO to hit the market, as part of this passive pipeline is the Mirae Asset S&P 500 Top 50 ETF and FOF that will invest in the ETF. Does this index make for a good portfolio addition?

The S&P 500 Top 50 index
The S&P 500 itself represents the 500 largest US-listed stocks by free-float market cap. This index is the go-to gauge for large-cap US companies. The S&P 500 Top 50 narrows this down even further, and represents the top 50 stocks within the S&P 500 by free-float market cap. In its own words, it showcases the ‘mega-caps’ of the US markets.
The S&P 500 Top 50 (S&P Top 50) is about as concentrated as the Nifty 50 is. The top ten constituents make up 58% of the index’s weight. That contrasts with the S&P 500’s 28.5% weight of the top 10 constituents. Sector distribution too is similarly more focused with the S&P Top 50 holding 38% in tech stocks against the S&P 500’s 27.9%.
The S&P Top 50 index is rebalanced annually every June; it was launched in November 2015 but index data has been back-worked and is available from 2005.
We have already explained how international investing is a good diversifier, and that the US market in particular is the better of the options in earlier articles. This S&P 500 Top 50 ETF and NFO adds to those available US options. It’s usability, though, hinges on two factors – the tracking error and whether it provides an alternative to the S&P 500.

Features of the index
The latter question (whether an alternative to S&P 500) above arises because the S&P Top 50 shares similarities with the S&P 500. Not only are fundamental metrics such as PE/PB ratios very close to each other, but their performance is as well.
In our own markets, the Nifty 50 and the Nifty 500 behave very differently in terms of returns and in characteristics such as volatility and downsides (we’re not getting into a discussion here about the differences between the Nifty 50/500 and the S&P 50/500 indices).
#1 Correlation
The S&P Top 50 shares very similar performance trends compared to the S&P 500. That is to say, the two indices are closely correlated. Considering the past 10 years, the correlation between the two indices is very high at 0.98. In other words, both indices will tend to chart the same return movement. In your portfolio, both indices will play the same role; the two indices don’t complement each other. The chart below shows the movement of the S&P Top 50 and the S&P 500 in the past ten years. As you can see, the performance of the two indices are more or less the same until very recently.
#2 Outperformance
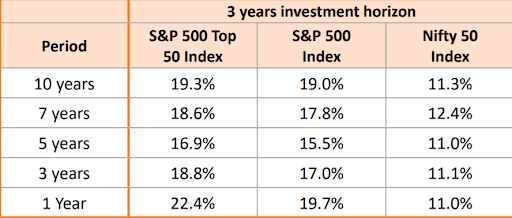
Average long-term returns for the S&P Top 50 and the S&P 500 are similar. As per data provided by the NFO documents, the 3-year average return over the past 10 years for both indices works out to 19%. In shorter 5-year periods, the average return differential is less than 2 percentage points.
It is in recent times that performance between the two indices is starting to diverge. As the earlier graph shows, the S&P Top 50 spikes from around 2020 onwards. This can partly be attributed to the stupendous rally in the top index constituents, which are tech-heavy. As with our own markets, the top index weights contributed significantly to rallies in years such as 2019. The current rally too, while broad-based, has still seen soaring returns for the top stocks. This could have magnified the S&P Top 50’s returns owing to its comparatively more concentrated holdings. Considering different rolling return periods over the past ten years do not show too much outperformance of one index over the other.
While the S&P Top 50 beats the S&P 500 about 70% of the time on a rolling 3-year basis over the past 10 years, the margin of this outperformance is very slim at 0.58 percentage points. There have been periods where the S&P 50 has lagged the S&P 500. A longer 5-year period has an outperformance margin of 1.8 percentage points, but this is partly influenced by the recent uptick in the S&P Top 50’s returns.
The table below shows the calendar returns of the two indices. While the S&P Top 50 has some edge over the S&P 500, the return differential is insignificant in most cases, except in 2020 due to reasons explained above.
In terms of return volatility, the S&P Top 50 and the S&P 500 are almost exactly alike across timeframes. However, on downsides, the S&P Top 50 is a shade better than the S&P 500. On a 3-year rolling period, the S&P Top 50 hasn’t slipped into losses while the S&P 500 has a few instances with a loss of about 1.5%. Neither index delivered losses for longer 5-year periods.
Should you invest?
Whether the current outperformance of the S&P 500 Top 50 will continue or expand is hard to predict now and will be known only over time. Going by past performance, the index does not offer a differentiated bet from the S&P 500. Therefore, the following points hold for the Mirae Asset S&P 500 Top 50 ETF:
- If you already own the S&P 500 in your portfolio, then there is limited benefit in adding the S&P Top 50 as it does not complement the index you already hold. You can skip the index. If you want to increase US exposure, go for the potentially higher-returning if higher-volatile Nasdaq 100.
- If you wish to have a concentrated exposure to very large companies, the S&P 500 Top 50 can be an option. It can also be an option to consider if you otherwise hold only active US-based funds and no passive fund.
- If performance divergence between the two indices remains or other factors such as volatility or upside capture starts to differ, then the S&P Top 50 may be another option to diversify portfolios. This is, of course, subject to the tracking error of the Mirae Asset S&P 500 Top 50 ETF.
However, what bears watching is the tracking error of the Mirae Asset S&P 500 Top 50 ETF. The FOF will be investing in the units of the ETF. The AMC’s other US-based ETF, the Mirae Asset NYSE Fang Plus ETF has seen a good amount of divergence between its market price and the underlying NAV of the ETF. Volumes have also been erratic, starting out larger but cooling off a bit lately. If you want to invest in the Mirae S&P Top 50 ETF, it's best to start small and take a call based on how tracking errors and volumes play out.


19 thoughts on “NFO Review: Mirae Asset S&P 500 Top 50 ETF and FOF”
Hi Bhavana
What is Tracking Error of Motilal Oswal S & P 500 Index Fund?
Can there be some comparison between MO S & P 500 v/s Franklin US Feeder in terms:
1. Rolling Return 3 years & 5 Years of both
2. Upside & Downside Capture Ratio of both
3. Volatility & Sharpe of both
Regards
Keyur
I have running SIP in MOS – Nasdaq 100 FOF , should I go for this NFO ?
Not really necessary. If your allocation is very low – say, less than 5% – then you can consider. But because there’s a lack of understanding about tracking error, you can go for S&P 500 index fund (also from Motilal) if you want to increase US allocation. – thanks, Bhavana
S&p 500 mos is also having 5pc tracking error, I believe. Isn’t it High or OK for international fund? What is the ideal tracking error one should Look at while investing in Indian and international passive fund ?
Hi
Incidentally I would like you to have a look (Ascertain the Long Term performance) of the following 3X Leveraged ETFs in the USA the Ticker Symbols are >>>> SOXL, TECL & TQQQ. They in the long term since their inception have given Steller Annualized returns viz…
ETF (Ticker Symbol) Start Date Annualized % Returns till date
SOXL 30th April, 2010 44.46%
TECL 30th Jan, 2009 57.72%
TQQQ 31st Mar, 2010 52.85%
They are very volatile but if the investors has stayed put the result is phenomenal isn’t it?
There are NO such similar concept ETFs in India.
HAPPY INVESTING
Prakash Joshi
Vile Parle (East), Mumbai 400057.
Thanks, will see. – Regards, Bhavana
Hi
Let me give some more relevant information with reference to the subject….
There is one ETF in USA (Ticker Symbol = XLG ) which tracks S & P 500 Top 50 Index. It appears the NFO will try to replicate the performance of the same ETF. The said ETF has came in existence on 04th May, 2005 and its till date “Annualized Returns is 10.35%” It’s present AUM is USD 2.17 B. This ETF is having Lipper Rating 5 (Top Most) under all the parameters viz. Total Return, Consistent return, Preservation, Tax Efficiency & Expense >{0.20%}. It is also having ‘Morningstar’ 4 Star Silver rating and falls under “Mega Cap – Growth” category. However, Mirae Asset AMC could have thought to offer / replicate (if, they wanted to be with “Mega Cap – Growth” category) a different ETF called ‘Vanguard Mega Cap – Growth’ (Ticker Symbol = MGK ). This though tracks a different Index called ‘CRSP US Mega Cap Growth Index’ and also falls under same category. Now, importantly MGK is all the way i.e. in all the otherwise comparable parameters is far far better than XLG. Now the choice is all yours.
My Best Wishes for Happy Investing
Prakash P. Joshi
Vile Parle (East), Mumbai 400057.
Thanks for deconstructing the 2 indices basis their past movements.
Was checking if there is a separate heading to compare Overseas schemes, find that some of them are tagged along with Others. With a significant number of overseas options from Indian MFs, I think you should consider this segment under a separate classification (unless I have missed it somewhere in the site!).
On a separate note, its perhaps time that you thought about providing users the option to create model portfolios which one can slice and dice to understand relative past performances/ risk etc.
Thanks,
Ramesh
1. Unfortunately, no. The way funds classify themselves under SEBI categories is different depending on whether they are FoFs or directly invest in stocks overseas. So data providers will classify based on the defined category.
2. We’re currently developing a tool to understand and compare MF performance. But model portfolios are not yet part of that. We’ll consider how to do that in the next stage. – thanks, Bhavana
Timely, well explained. Thank you Bhawna ji.
Thanks! – regards, Bhavana
Present I have a SIP Motilal Oswal S&P 500 Index Fund
I’m Planning to stop above Mutual Fund start again in this fund S&P 500 Top 50
I do hedging from my portfolio
It is your call – but do note that we have said that you do not need this ETF if you have the S&P 500 already. Also be aware that tracking error for the ETF/FOF is unknown at this time. – thanks, Bhavana
Hi… I am already invested in Motilal Oswal S&P 500 Index fund… I think I can give this one a pass. What % of diversification do you recommend .. as of now its 2% of my overall portfolio base
For US/overseas exposure? 10 to 15% is good. You can mix different options, like the S&P 500 and the Nasdaq, or other global funds within this. – thanks, Bhavana
Hi Bhavana
Although I find the article very logical and well researched, I found it lacking in a couple of things:
1. You’ve only made data and return comparison between S&O 500 and it’s Top 50 version, whereas the most popular index for Indian investors remains the Nasdaq 100. It would have made the article even more thorough if it was a 3 way comparison – in constituents, weights, returns, correlation and rolling returns.
2. One of the things that I hear during what is being written by others on the same topic is that (at least theoretically) a 50 stock ETF is expected to have a lower tracking error than a 500 stock ETF. Is there some substance in this – and how much of that should we expect in this case practically.
3. Has the AMC given an indication of the cost (TER) ? If yes, how is that compared to the S&P500 and N-100 options already available to Indian investors?
And as they say ‘Ye dil maange more’, as an Indian investor, I’m more excited by the soon to arrive FOF by Navi AMC which would have Vanguard Total Stock Market ETF as the underlying asset. I would ideally throw that too in the ring to see a knock out fight 🙂 . But I’m sure you’ll wait for that till the launch is formally announced.
Regards
Raspreet
1. We stuck to the S&P 500 because it’s the closest comparable, and the choice would ideally be between the two. We can’t always evaluate every single option there is, for every new US fund that comes up 🙂 We won’t be able to comment on tracking error and how much to expect; it depends not just on the AMC’s ability to track the US index, but also domestic trading volumes and divergence between NAV and market price – this is higher in the Fang Plus ETF, as we’ve noted in the article. The AMC has not given any indication of what TER will be. – thanks, Bhavana
I have a SIP running in Parag Parikh Flexi cap fund.
Should I go for this NFO?
Thanks
You could, but please note that we do not know what tracking errors will be. If tracking errors are higher, it will impact performance. – thanks, Bhavana
Comments are closed.