The author is an external contributor. Views are personal and do not reflect the opinion and views of PrimeInvestor.
We have been advising caution on fresh major exposures in the markets in the last few updates and more specifically in the previous Nifty 50 update where we highlighted how we market participation was thinning out and select stocks and sectors are powering the Nifty ahead.
Interestingly, the Nifty marched to new all-time highs and even almost hit the target of 25,100-25,200 that was mentioned in the previous update. But the index has subsequently seen a sharp cut, retracing little over 4%. In this update, we shall focus on the short-term outlook for the index and try to put things in historical context.

Nifty short-term outlook
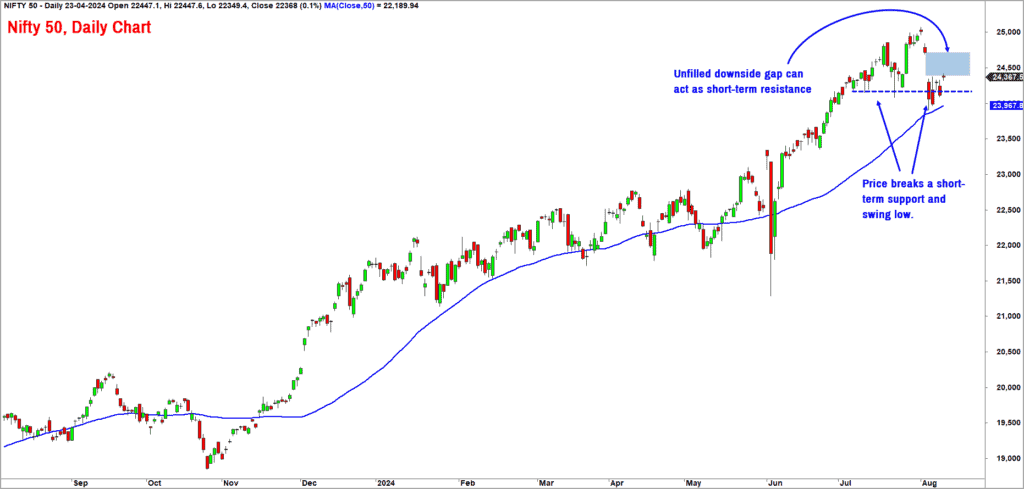
Here is the daily chart of the Nifty 50 index. The price recently has breached the prior swing low at 24,074 which is an early sign of weakness. After several months, the Nify 50 index opened with a huge gap down and closed near the day’s low on two successive days, which again is a different behaviour in contrast to recent price action.

Unless the index moves above 25,200, there would be a strong case for either a time-wise correction or a price correction. Time-wise correction would be more painful as the price action could get more volatile and range bound. Short-term trading in stocks or the index would get too difficult in such an environment. If the index gets into a price action, the fall and the subsequent recovery could be relatively swift in terms of length of time taken, in comparison to time-wise correction.
The recent fall had pushed the price and the market breadth into an oversold zone, triggering a bounce back in the past few days. This rebound could probably last for a few more days and could push the index higher to the 24,500-24,800 zone. This zone also coincides with the downside gap recorded a few days ago.
Therefore, until the index moves above 25,200, it would be advisable to remain cautious as the price action could get more volatile and even more stock and sector specific. If you are someone who wishes to engage in short-term trading, then be extremely nimble-footed and lock in profits aggressively.
If the index drops below the recent low of 24,000, it will then complete a bearish sequence of lower highs and lower lows. More importantly, a fall below the 24,000 level would also result in a breach of the 50-day moving average, which would be another sign of weakness.
Historical perspective
After the sharp fall witnessed on June 4, the index witnessed a sharp cut on August 2nd and August 5th. Let us try to look at the historical performance of the Nifty 50 index since 1996 (27-years of data) and the S&P 500 index wherein there is more historical data to look at.
Studies indicate that the average intra-year drawdown for the S&P 500 index from 1928 to 2023 was 16.4%. Since 1950, the average correction in a given year was 13.7%. And in this century, it has been 16.2%. Essentially, a double-digit drawdown happens around two-thirds of all years since 1928 in the S&P500 index. Let us check if this data is relevant and valid in the Indian context.
Again, the data from the year 1996 to 2023 indicates that there have been 25 years (of the 28 years), where the Nifty 50 index has witnessed a correction of more than 10% in a calendar year. There have been just 3 years where the drawdown or the correction has been in single digits with 2023 being one such recent data point.
Given the historical behaviour, the odds are in favour of a double-digit correction in 2024 too. It however remains to be seen if 2024 turns out to be an exception, similar to 2023. The steady inflow of SIP money can probably be a strong factor influencing the data in the last couple of years.
But if one looks at the US market which has probably been through this phase much earlier, it is evident that double digit corrections happen more often that not. We will have to take it one step at a time before jumping to conclusions about the domestic fund inflows in mutual funds and its impact on market sentiment.
Let us now shift our focus to few sectors and market segments. To begin with, let us get started with the Nifty SmallCap 250 index.
Nifty SmallCap 250
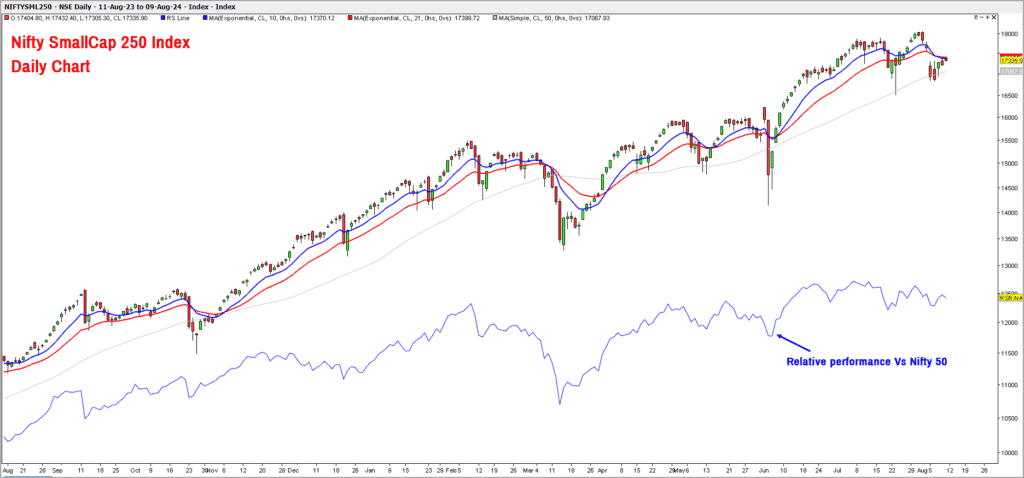
As highlighted in prior updates, the Nifty Smallcap 250 has been an underperformer versus the Nifty 50 over the last several months.

This segment has been a relative underperformer for a while now and there are still no signs of improvement yet. Similar to the Nifty 50, this index too has breached the prior swing low and trading very close to its 5-day moving average.
A close below 16,700 would be a major sign of weakness and could open up further downside targets extending up to 14,800-15,000. Unless the index moves past the recent high of 18,200, it would be safe to operate on the premise that the small cap universe would remain an underperformer and drift lower.
Sector indices
Now let’s take a look at some sector indices and where they are headed.
- Nifty Pharma: This index has been a star performer recently and is currently trading at its all-time highs. This index has also been an outperformer in relation to the Nifty 50 index. The short-term outlook for the Nifty Pharma is bullish and a move to the next target at 22,800-23,000 appears likely. The trend would turn bearish only a close below 20,200.
- Nifty IT: After strong signs of bullishness and outperformance, this index has slipped a bit in the recent fall in the Nifty 50 index. The medium-term trend remains bullish and a breakout above 41,300 would push this index into a stronger bullish orbit. A fall below 37,100 would be an early sign of weakness and would warrant caution thereafter.
- Nifty Bank: The Nifty Bank Index has a relatively more pronounced bearish chart structure. The price is tracing out a bearish sequence of lower highs and lower lows. More importantly, the index has also breached its 50-day moving average which another sign of weakness. The early signs of flourish and outperformance that was visible a few weeks ago is fading away. Unless there is a breakout above 52,500, this index could remain bearish and continue to underperform the Nifty 50.
- Nifty FMCG: Along with the Nifty Pharma, this is another index that is setting up well. The short-term outlook is bullish and a rally to 66,000-67,000 appears likely. This index has also displayed signs of outperformance compared to the Nifty 50 index. Keep an eye on the FMCG sector for short-term to medium-term strategic bets.
To sum up, the short-term trend for the Nifty 50 index seems to be veering towards the bearish direction. As emphasised in the previous update, be cautious and extremely selective in picking stocks. Look for stock / sector specific opportunities and take strategic short to medium term bets. This is probably not the time to make big lump sum allocation in the market.


3 thoughts on “Technical outlook: Short-term trends in the Nifty 50”
Very useful and articulated in an easy to understand way. Thank you!
Hi Krishna ji, Any updates on Gold and Silver pls.
Hello Srikanth:
We will try to accommodate a brief outlook on precious metals in one of the upcoming updates.
B.Krishnakumar
Comments are closed.