The Indian ETF investment space is small compared with developed markets such as the US. But with market indices trouncing several active equity funds, investor interest has been kindled in passive investment options.
The increasing interest in passive investing shows up in the rapid ETF activity over the past few years. ETF AUM has grown 13-fold (or at an annual 67%) to an average of Rs 3.72 lakh crore (September 2021) in the past 5 years. With ETFs being launched on several new indices apart from the standard Sensex and Nifty 50, taking stock of the ETF space will help you pick out the options that can help diversify or build your own portfolio.
In this article, we’ll dig into the various ETFs available, what metrics to use in deciding which one to go for, and how to use them in your portfolio. Do note that this is an article geared towards those unfamiliar with ETFs. If you’re a seasoned investor, skip this article and we’ll see you in the next one! But before you go, do check our ETF recommendations and ETF ratings.
History of Indian ETFs
The beginning is a good place to start! If you are entirely new to ETFs, begin with this article on what ETFs are and their benefits. You can learn about the difference between ETFs and index funds here.
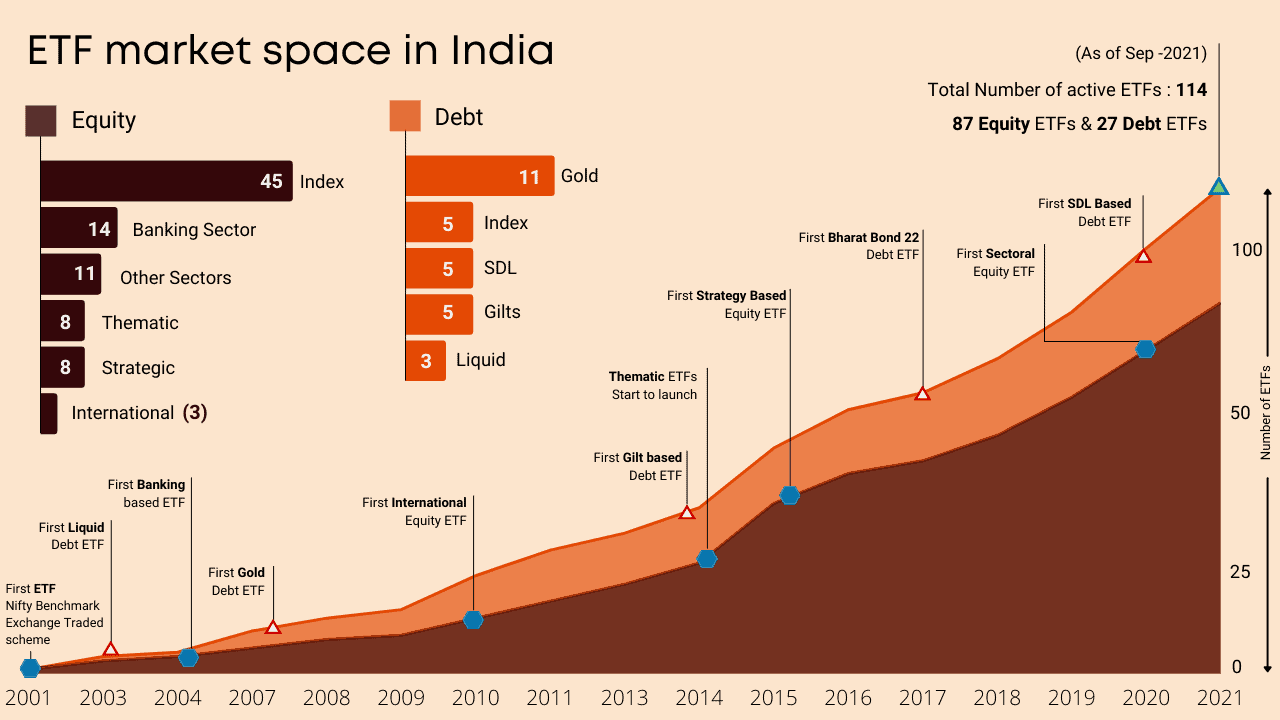
The chart above is a snapshot of the 20-year history of ETFs in Indian markets. As you can see, between 2001 and 2013 the ETF market had limited options, going by the number of ETFs that there were then. For example, by December 2013 there were a total of 33 ETFs of which 21 were equity-based and 12 debt-based. The ETFs lacked diversity in strategies and were mostly based on key benchmark indices such as Nifty and Bank Nifty. More, these indices were more to help traders in the F&O market than a real investment avenue for long-term equity portfolios. In the debt segment, there options were more or less restricted to the liquid and gilt segments.
The tide turned from 2014, and the ETF market picked up pace, gaining in both number of ETFs and inflows. Between January 2014 and December 2017 – i.e., a span of just 4 years – 33 ETFs were launched doubling the total number of ETFs to 66. New types of ETFs in both equity and debt emerged as well. In equity, thematic and strategy ETFs were launched and in debt, apart from gilt, target-maturity funds emerged as a category – including both PSU bonds and SDL instruments as underlying instruments. The advent of PF money also caused a meteoric rise in ETF AUM (at close to Rs 4 lakh crore now).
Now, let’s see the underlying index nature of these ETFs.

Kinds of ETFs available in India
The chart below gives you an idea of the various indices for which you have ETFs today. As you will see, the maximum number of ETFs are available for bellwether indices Nifty and the Sensex.
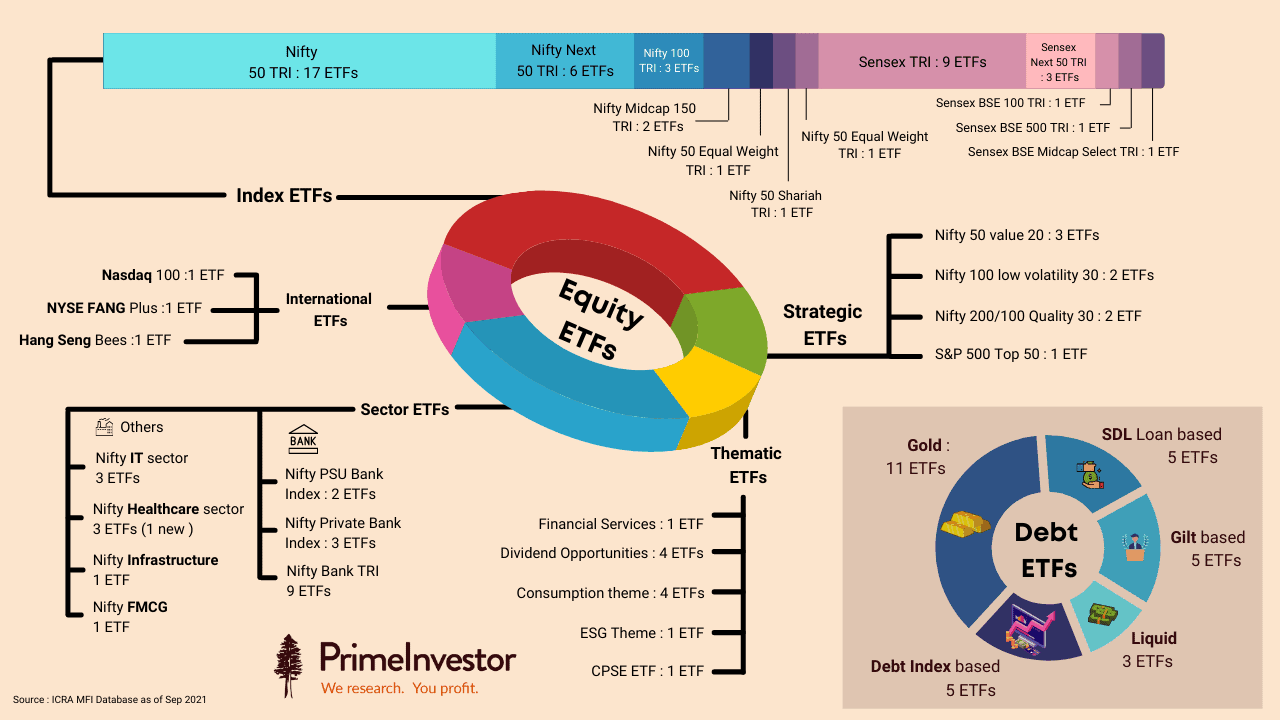
Equity ETF options can broadly be classified as follows:
- Broad-based market cap ETFs based on indices such as Nifty 50, Sensex, BSE 500, Midcap, and so on. These indices are the ones you can use for the large-cap/mid-cap/small-cap allocation in your portfolio, like you would with equity funds. Keep in mind that indices can behave similarly, and therefore, understand the nature of the index before investing. For example, the BSE 500 would be a high-returning, high-risk index as would a mid-cap index. The Nifty 50 and the Sensex, similarly, move more or less in the same fashion.
- Sector ETFs such as the ones for IT, healthcare, and banking. These ETFs can be used to boost portfolio returns by tapping into specific sector opportunities; since broad-based indices are spread across sectors, the impact of strong performance in specific sectors tend to be dissipated. However, you will need to time entry and exit for such sector calls.
- Thematic ETFs such as ESG, dividend opportunities, consumption and so on – similar to sector ETFs, they help diversify a portfolio away from the broad large, mid or multicap indices or even funds. Depending on the nature of the theme, some may require timing in investments while others may be longer-term.
- Strategy ETFs such as value, quality, low volatility as so on. Again, these introduce style diversification in a portfolio and can form part of long-term portfolios.
- International ETFs such as the ones built on the Nasdaq 100 and S&P 500 indices
With Debt ETFs, the options are as follows:
- State development loan (SDL) ETFs, which are a combination of SDLs issued by different states. These are low on credit risk, but come with some volatility depending on the maturity of the underlying index.
- PSU bond ETFs, similar to SDLs, come with low credit risk, but some degree of volatility based on the maturity.
- A combination of the above two
- Gilt ETFs, which are typically 10-year maturity
- Liquid ETFs
And then you have gold ETFs.
The options may seem aplenty but remember, you do not need to invest in them all – you just need to pick those that suit your portfolio the best. This apart, not all of them are well traded. For example, the Sensex ETFs are far lower trading than many of the Nifty indices. Many of the sector indices are hardly traded on a daily basis. So, not every ETF out there is an ‘investable’ option for you. You can check the various ETFs under each of these indices and the details of liquidity (turnover) of these ETFs in Prime ETF Rankings.
What to look for while picking an ETF?
Choosing the mix of passive funds for your portfolio is pretty much like building a portfolio with active funds. You need to have the right asset allocation mix appropriate to your time frame and risk appetite. When it comes to your equity portion, you then need the right combination across market-cap segments and strategies fitting that risk profile and time frame – such as a mix of large and midcap or value and high beta and so on. This article explains how to build a diversified portfolio using equity indices, which you can use as pointers on how to use each index.
With debt, your options in the ETF space are still evolving. So you may need to use some active funds for some of your requirements in debt. Do read our article on the passive options in the debt space and how to use them.
Once you get the structure on which indices to go for, the question of identifying the right ETF for a given market cap or strategy arises. For example, indices like Nifty 50 or Next 50 have plenty of ETF options. In other ETFs, while the index may certainly offer promise, the ETF itself may not be an ‘investable’ option. Therefore, it becomes important to use the right metrics to narrow your choices. Here are the most important ones to look for:
#1 Liquidity
Most ETFs in India, whether having a fancied index or not as the benchmark, do not enjoy high turnover on the stock exchanges. In other words, no large values or volumes are bought or sold. This can be a significant red flag when it comes to actually investing or even choosing ETFs.
When traded volumes are low, two things can happen. One, the market price of the ETF can deviate significantly from its NAV. Since NAV is the real value of the ETF, you may end up buying ETFs at a price much higher than the NAV or sell at a price far lower than the NAV. Second, when you try to buy or sell large quantities, you may either not be able to place the buy or sell trades, and your own trade may distort the price. For this reason, it is necessary that the ETFs you choose have reasonable liquidity.
You can check liquidity by looking at the traded value for at least 3 months as well as the number of days the ETF was traded. When comparing two similar ETFs, the one with higher value traded and traded on all or almost all trading days is preferable. As mentioned earlier, this data is available along with our ETF ratings. It’s important here that an ETF’s traded value is not confused with the ETF’s size.
Size is nothing but the ETF AUM, but a low AUM does not necessarily mean that trading will be thin or vice versa. Barring the popular ETFs such as the Nifty or Bank Nifty, most ETFs may not have a high AUM but some may still have reasonable traded value. The reverse is also true.
For example, see the table below. It shows three different Nifty 50 Index-based ETFs along with their AUM and trading volumes.
As you can see, the Axis ETF is low on both value traded and AUM. The SBI ETF has high AUM but not high traded value - in good part because the bulk of the AUM is from investments the EPFO makes, but which does not translate into trading. The Nippon ETF has AUM lower than the SBI ETF but has a very high trading volume. As an investor, it is more important for you to focus on the traded value of an ETF than the AUM size.
#2 Tracking Error
Since an ETF will mimic a stated index, its returns should be like that of the index. Of course, it cannot be exactly the same as an ETF has an expense ratio, some transaction costs, cash holding, and the time-lapse in incorporating changing index constituents when a stock enters or exits the index. You can read more about tracking errors here.
A higher tracking error compared to peers tracking the same index means that the ETF is not efficient. That is, your returns having invested in the ETF will differ from the actual return that the index delivered. Therefore, you need to look for an ETF with the least tracking error. While tracking errors are typically higher when there is lower liquidity, it is not a rule. An ETF can still keep errors under control even with sedate volumes (see the next point on market makers below).
But while low tracking error is ideal, bear in mind that some indices will be harder to closely mirror than others simply because of the nature of the stocks/debt instruments it houses. For example, mid or small-cap indices may see their ETFs suffer higher tracking error than say, an index based on the Nifty 50. This is because small-and-mid-sized stocks are less liquid than larger stocks and have higher impact costs. This makes it harder for ETFs or funds to track these indices very closely. Therefore, don’t look at absolute tracking error alone - compare with similar peers and understand the possible causes of such errors.

For example, see the table below. It shows the tracking error for three ETFs tracking the Nifty Next 50 index. There are two return periods considered - 1 month returns rolled daily for the past 1 year and 1-year returns rolled daily for the past 1 year.
As you can see, the SBI ETF has a lower tracking error across timeframes. Mirae & ABSL ETFs have marginally higher deviation. (these are just illustrations and not recommendations.)
#3 Deviation from NAV
You may be aware that ETFs have two prices. One is the NAV - which is the market value of the underlying stocks/securities in the ETF. The other is the market price of the ETF - that is the price at which it is traded in the stock exchange.
When you buy an ETF, you buy it only at the market price unless you subscribe to a new offer, or, as a large investor, get a primary issuance directly from the AMC. It is important that your market price is close to the NAV. If an ETF is poorly traded, odd trades may result in price moving away from the NAV. These deviations will impact the returns you make; the NAV movement reflects the actual underlying index returns. Wide deviations between the market price and the NAV, therefore, indicate that there is an imbalance in the demand-supply of units.
An AMC tries to correct this and ensure that market prices don’t significantly move away from NAVs and improve an ETF’s liquidity by bringing in folks called market makers. A market maker’s job is to buy and sell underlying securities to create or suck liquidity as the case may be). Typically, AMCs with a clear and focused approach to ETFs are more likely to have effective market makers and thus keep deviations and errors under control.
Therefore, before picking an ETF, look at the difference between the market price and NAV to ensure you minimise impact on return.
For example, see the table below. It shows the standard deviation (i.e., fluctuations) of the market price from the NAV. High fluctuations could indicate erratic volumes. (Please note that these are illustrations and not recommendations)
#4 Expense Ratio & AUM
Like active mutual funds, ETFs too have an expense ratio. But expenses are usually very low as there is really no active management involved. There are also no different direct and regular plans (and NAVs or expense ratios) unlike mutual funds, since an ETF is traded on the exchange. There is only a single NAV.

You only pay brokerage charges to your distributor for placing the trade (like any other stock trade) and do not pay any distribution cost. Most market-cap index based ETFs have lower cost (0.5% to 0.75%) while thematic/strategy ETFs have marginally higher cost (even up to 1.5%). But like the illustration below suggests, there can be variations in expense ratio of ETFs that track the same index.
At PrimeInvestor, we use these key metrics and more to rate and recommend ETFs. You can check our ETF Ratings here. For those of you new to passive investing, we provide ready-to-use ETF portfolios (check Passive Investing here) with both ETFs and index funds to make it easier for you. You can either go with the portfolio as-is, or modify allocations to suit your timeframe and risk. If you would like to build your own portfolio of ETFs, check out Prime ETFs, our recommended list of ETFs. You can, alternatively, invest in our Core & Satellite ETF smallcase portfolio here :
