The author is an external contributor. Views are personal and do not reflect the opinion and views of PrimeInvestor.
In the previous update on the Nifty 50, we had mentioned that there was nothing bearish in the Nifty 50 chart and only a fall below 21,700 would be a cause of concern. We had also highlighted the possibility of a short-term pullback which played out. In this post, we shall address what is in store for the Nifty 50 index in the short-term and the sectors and market indices to focus on.
Nifty 50’s short-term outlook
Here is the daily chart of the Nifty 50 index. As highlighted, the price has been confined to a broad range of 21,700-22,800 in the past few months. A decisive break out of this range is needed to set the tone for the next directional move in the Nifty 50 index.
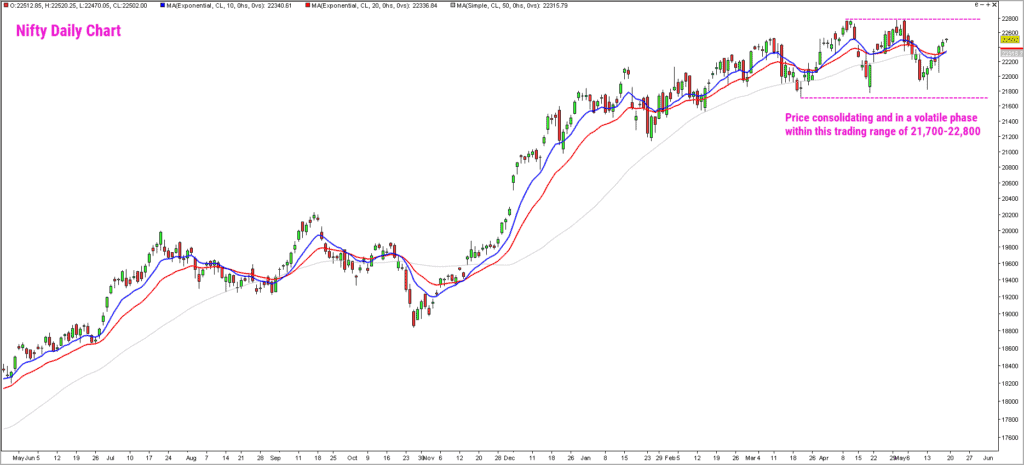
There are no signs of bearishness yet in the daily chart of the Nifty 50. As mentioned in the previous update, a fall below the swing low at 21,700 would be an early sign of a deeper retracement. Until then expect a volatile rangebound scenario to prevail. A move above 22,900 would be a bullish sign and could propel the index towards our 2024 target of 24,000+ that was discussed a few months ago.
Let us look at other parameters to glean some insights about the overall health and short-term prospects for the Nifty 50 index.

- One, the breadth indicator – this portrays sort of a mixed picture. The PF-X% breadth indicator, in the short-term, has reversed from the oversold zone and is still in the neutral zone. Hence, there is no major threat of a sharp correction from the breadth perspective. But the negative divergence between the price action and the breadth indicator in the past few weeks is a cause of concern. It suggests that fewer stocks are participating in the rally.
- The breadth in the medium term and long term have cooled from the overbought zone and is in the neutral zone now, which is a healthy sign. In this scenario, it would be prudent to wait for the breakout from the ongoing trading range to determine the direction of the next major move in the index. Until the breakout happens, remain stock specific and keep your position size relatively small to tide over the volatility.
As always, we shall come up with timely updates based on the unfolding price action.
Other market indices
Let us switch our focus to the indices that are displaying relative outperformance in comparison to Nifty 50 index. Before heading in that direction, it is pertinent to point out that the Nifty Small Cap 250 Index continues to underperform Nifty 50. While the Smallcap 250 has scaled a new all-time high recently, the relative strength chart is yet to cross its prior highs, suggesting negative divergence.
The action here has turned extremely stock-specific. Remain cautious and focus on your exit plan in the small cap segment. It would be prudent to wait for signs of relative outperformance before considering exposure in the small cap segment.
Nifty Next50
This index has been the star performer of 2024 thus far. The short-term outlook for this index remains bullish and expect the index to hit the near-term target of 77,000-80,000. A fall below 61,500 would invalidate the short-term positive outlook for this index. Here is the chart capturing the performance of various indices in relation to the Nifty 50 index. The chart captures the performance from March 20 low recoded by the Nifty 50 index.
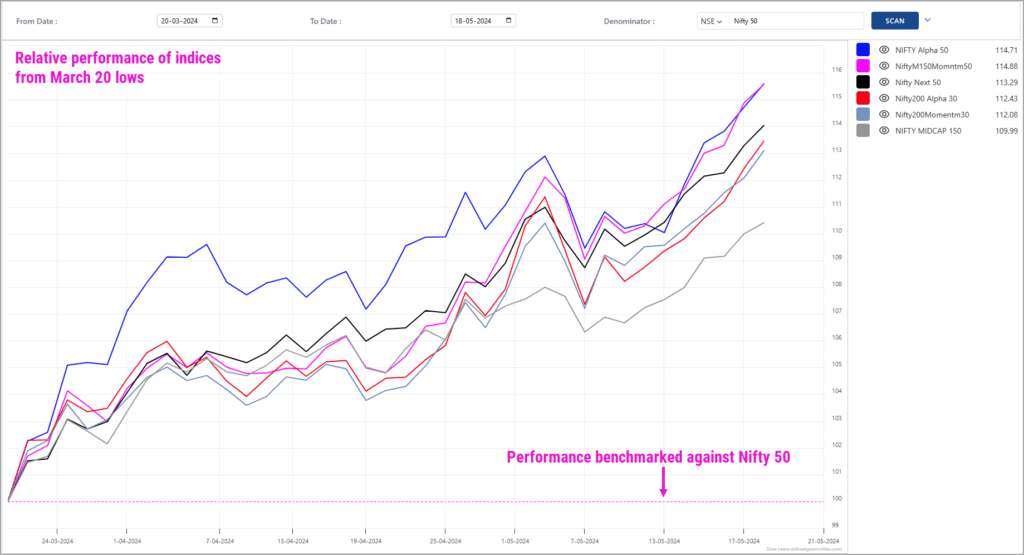
Along with the Nifty Next 50 index, it is apparent from the above chart that the Nifty Alpha 50 index has been another star performer in last couple of months.
Nifty Alpha50 Index
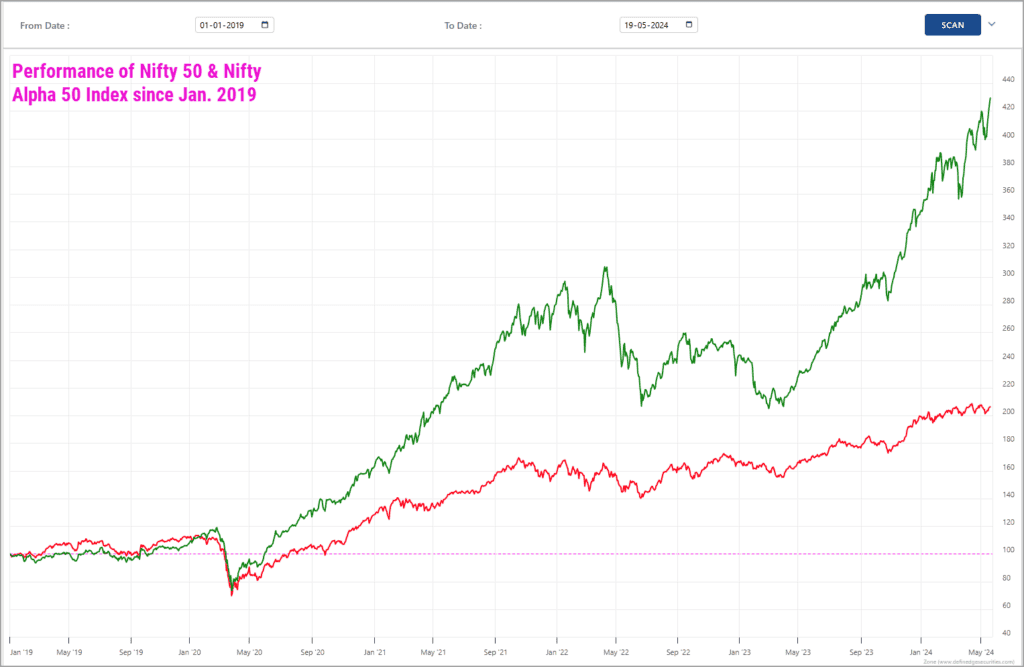
This is an interesting index offered by the NSE. The factsheet about this index (available at https://niftyindices.com) indicates that there is a relatively high correlation of 0.84 with Nifty 50. Hence, whenever you sense extreme pessimism and anticipate a reversal in the markets, it would make sense to deploy lump sum investment in this index. This index outperforms the Nifty 50 index whenever the Nifty 50 index is in an uptrend. This is clearly borne out in the chart featured below, which captures the performance of Nifty 50 index and Nifty Alpha 50 index since January 1, 2019.
It is clear that the Alpha 50 index outperforms handsomely when Nifty 50 is in an uptrend. It is in this context that I recommend considering exposures in this index whenever one suspects that a bottom is in place for the Nifty 50 index. Or better still, consider exposures in this index when Nifty turns around and displays early signs of bullishness after a corrective phase.
Nifty Midcap150 index
This is another index displaying strength and momentum in the past few weeks. The short-term target for this index is 23,200-23,300. A fall below 16,000 would invalidate the bullish outlook. Considering that this index is displaying strength, one may also look at the Nifty Midcap150 Momentum 50 index.
Comex Gold & Silver
We covered the outlook for gold in the previous update. We had mentioned that Comex gold could head to the short-term target of $2,423. The price has reached this target and appears on course to hit the next major target at $2,515-2,598 per troy ounce. The outlook for comex gold would turn bearish if the price falls below $2,140.
While Comex gold hit all-time highs last month, Comex silver is yet to do so. It is still way below its all-time high of $38.18 recorded in April 2011. But the recent price action looks very bullish for the white metal. Have a look at the weekly Comex silver posted below.
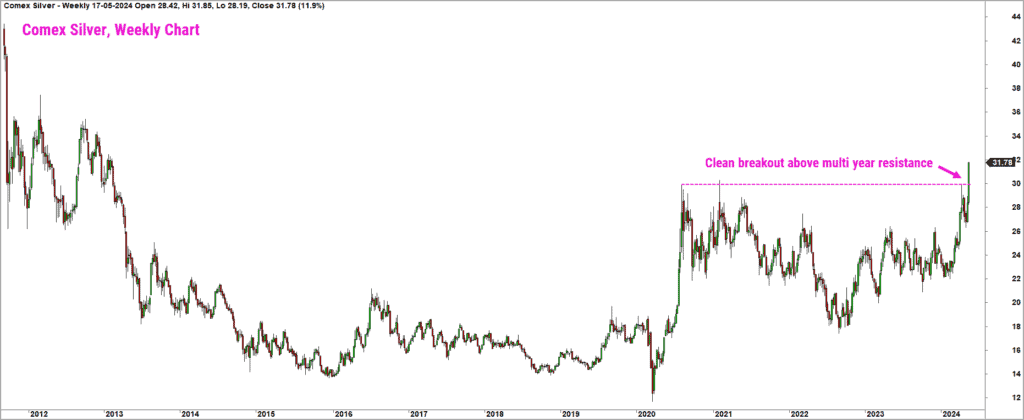
As highlighted in the chart, there is a clear breakout above key resistance in the silver chart, which is a sign of strength. The short-term target for Comex silver based on the Point & figure chart works out to $33.5 – $34. There are much fancier targets but let us take one step at a time. The short-term bullish view for Comex silver would be under threat if the price falls below $25.5.
Before we wind up our discussion on precious metals, it would be pertinent to point out that silver is displaying relative strength compared to gold in the past few months. If this trend persists, expect silver to deliver better returns compared to gold.

Sector-wise trends
Sectors such as Nifty Realty, Nifty PSU Bank, Nifty PSE and the railway stocks were the top performers of the rally that commenced in March 2023. Most of these sectors sort of topped out in January-February of this year and has since been in a correction. Interestingly, the PSE sector has bounced back strongly in the past few weeks and remains the top pick on a technical basis.
After a brief correction, there has been a renewed market interest in the defence sector and metals. The Nifty Metal Index looks bullish and could head to the short-term target of 10,700-11,200. Look for exposure in this sector via the mutual fund route. Stocks having exposure to the defence sector are also displaying bullish momentum. Look to enhance exposures in these stocks on weakness.
The railway stocks are also performing well. Here is the equal weighted index of the railway stocks.
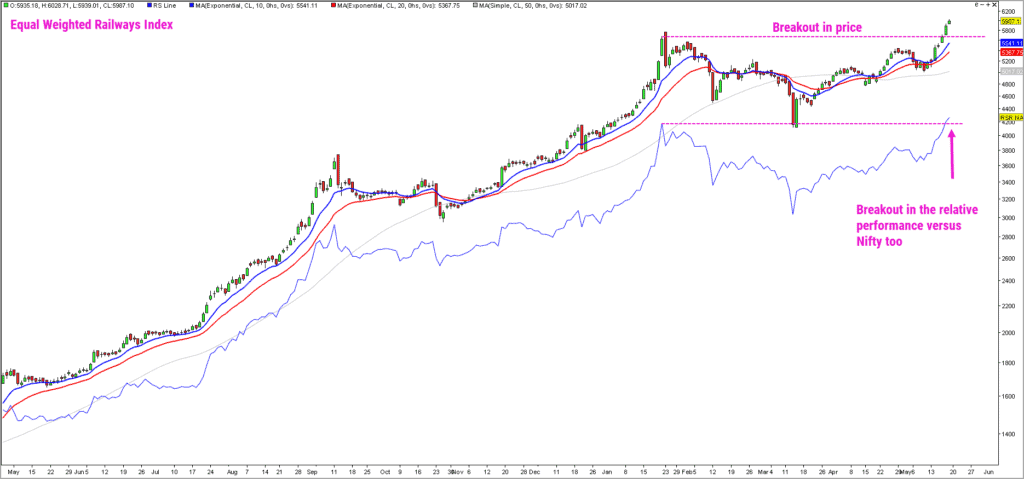
This index is comprised of the following six stocks having equal weightage. This index is created by me, and it is not difficult to replicate it. There are quite a few platforms which help in this regard. One may look at the TradePoint software from Definedge Solutions; Tradingview.com is another resource in this context.
- IRCON
- IRCTC
- RailTel
- RVNL
- Texrail
- Titagarh
As highlighted in the chart, there is a clear breakout in the price chart as well as the relative performance chart (thin blue line in the chart), indicating bullishness. Look for opportunities in this sector. Of course, as we emphasise regularly, have a clearly defined exit plan for any investment decision you make.
Beyond these, Nifty Consumer Durables index is another one displaying a lot of strength and appears bullish. The popular ones such as Nifty Bank and Nifty IT remain relative under performers. Wait for concrete sings of strength and outperformance before taking exposure in these two sectors.
To sum up, it is time to be cautious and selective in terms of stock & sector exposure. Do not take full sized exposures until the Nifty 50 index moves above 22,900. Focus on managing and exiting the existing holdings as and when your exit criteria is triggered.


2 thoughts on “Technical outlook – Which index can you focus on?”
Thanks for this detailed article.
What are the suggested options to take exposure to Nifty Alpha50 Index. It so appears that post the Nifty crossing 22,900 it may be apt to take exposure here. Pl. opine.
Also, when is it not recommended to take exposure to this index.
Hello:
Given the high correlation factor, it would be appropriate to take exposure in the Alpha50 index when Nifty 50 is in an uptrend. The earlier you identify the up cycle, the better the returns. In this context, it would be reasonable to take exposure in this index if there is a breakout above 22,900. I would rather recommend exposures when there blood on the street and Nifty displays signs of recovery thereafter. Any medium term breadth indicator could be a good proxy in this regard.
For example, track the percentage of stocks trading above their 50-day simple moving average from the Nifty 500 universe. Take exposure in the Nifty Alpha 50 index whenever this indicator drops below the 30% mark and turns around. There are lots of low cost software / data providers that offer these kind of breadth data.
This is just an example and there are multiple ways to skin the cat.
Hope this helps! If not, please drop in a line.
B.Krishnakumar
Comments are closed.