The author is an external contributor. Views are personal and do not reflect the opinion and views of PrimeInvestor.
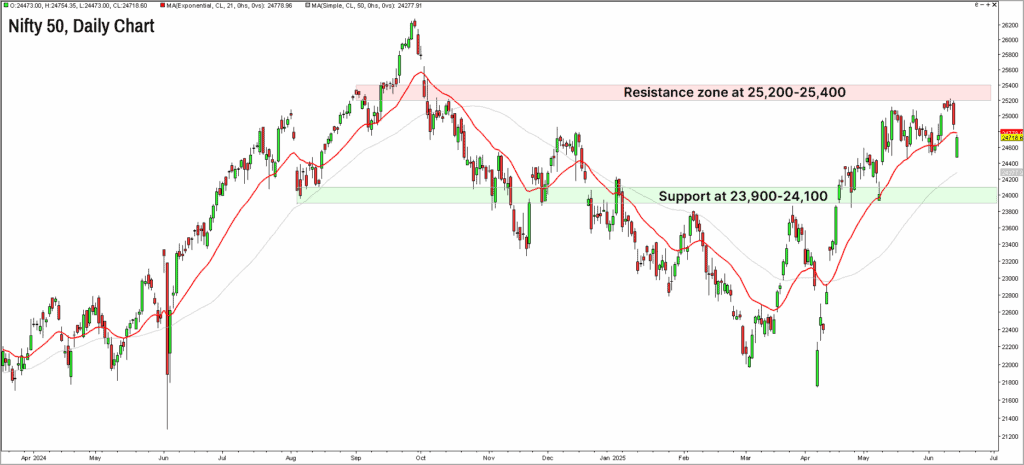
We had sounded caution in the previous update highlighting that the Nifty 50 index has to move past the crucial resistance zone at 25,200-25,400 to indicate the scope for further bullishness. The Nifty 50 index is still struggling to get past this hurdle, suggesting that the recent sideways and volatile price action is likely to sustain.
Let us take a closer look at the short-term chart of Nifty 50 index along with the breadth indicators to assess what is in store in the near term. As always, we shall also discuss a few sectors that are displaying bullish momentum and signs of outperformance.
Nifty near-term outlook
The inability to breakout above the resistance zone at 25,200-25,400 indicates lack of upside momentum and waning buying interest. The Nifty 50 index has been confined to a trading range recently and the daily chart featured below suggests that the price is sandwiched between the support zone at 23,900-24,100 and the resistance zone at 25,200-25,400. Either a breakout above the resistance zone or a breach of the support zone would set the tone for the next big move in the market.
A look at the short-term breadth indicator of the Nifty 50 index and also the breadth indicator of the broader markets suggest that the buying interest is creeping into the broader markets recently.
The PF-X% indicator the short-term breadth indicator that we track consistently. This indicator captures the percentage of stocks that are in a bullish swing in the Point & Figure chart. This breadth indicator for the Nifty 50 index has been struggling to make it to the overbought zone of above 75%, suggesting lack of participation and buying interest in the Nifty 50 stocks.
There is also a glaring negative divergence between the price action of the Nifty 50 index and the PF-X% breadth indicator. While the price has managed to seek higher highs in the past few weeks, the breadth indicator has recorded a series of lower highs. This indicates the underlying lack of momentum and buying interest.
As mentioned above, the scenario is a little different when it comes to the broader market. Let us take a quick look at the long-term breadth indicator capturing the percentage of stocks trading above their 200-day moving average. This breadth indicator for the MidSmall Cap 400 index has displayed consistent improvement recently and has crossed the 50% mark, indicating buying interest creeping into the broader markets.
The other worrying factor is the recent outperformance of gold versus Nifty 50. Gold has outperformed Nifty since mid-May and the recent geopolitical developments has also played a part in imparting bullishness in gold price.
Keep an eye on the relative performance of Nifty versus gold and also keep a tab on the key support and resistance zones mentioned earlier. For now, it would be advisable to remain light and avoid big ticket equity commitment, especially in the large cap stocks. As always, we will come up with timely updates with fresh targets once the Nifty 50 index wriggles out of the current trading range that it is confined to.
Sector & broad-market outlook
Next up, a quick look at sectors that are bullish and outperforming Nifty 50.
Nifty Bank Index
This index managed to outperform Nifty 50 in the past few months. The recent price action, however, is not that encouraging.
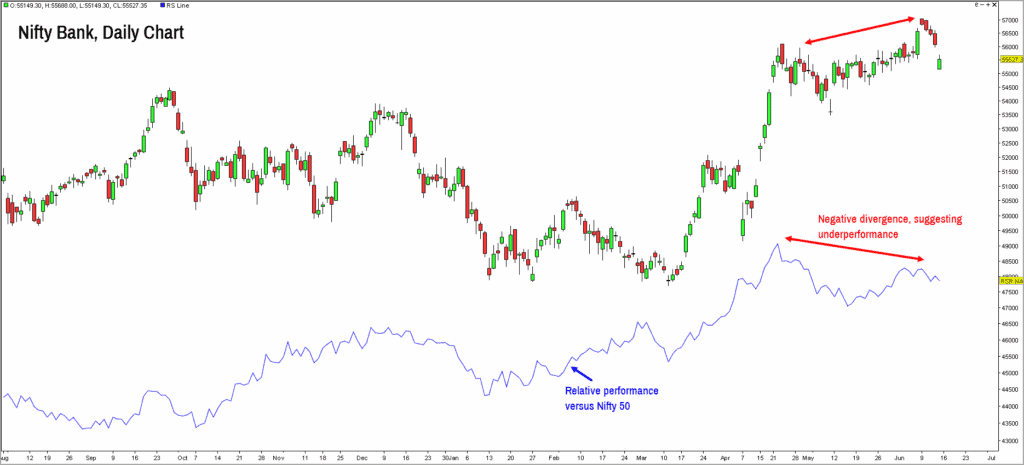
As highlighted in the chart above, there is a glaring negative divergence between the price action and the relative performance, suggesting one should be cautious in this sector. Though the price trend is still bullish, it would be prudent to wait for signs of outperformance before enhancing exposures in this sector. A fall below 53,000 would be an early sign of weakness and could open up more downside threat for the bank index. The index has to pick up momentum and also move past the 58,000 mark to suggest resumption of uptrend.
Nifty MidSmallCap 400 Index
As highlighted in the section above, this index has displayed signs of buying interest and has outperformed the Nifty 50 index in the past several weeks. Keep your shopping list of stocks from the mid and small cap space handy! Any signs of resumption of the uptrend in Nifty 50 index may be used to invest across the stocks from this shopping list. From a technical perspective, a fall below 19,000 would be a sign of weakness while a breakout above 22,100 would indicate that the index could head to fresh all-time highs and a rally to 23,500-24,000.
Nifty Realty & IT
Nifty Realty and Nifty IT indices are displaying early signs of promise. Nifty Realty Index in particular has displayed a sharp bounce back recently and has also outperformed the Nifty 50 index from the low recorded on April 4. Therefore, keep the Realty index also in your radar; a breakout above 1042 could push the index higher to the next target of 1,150-1,200.
The Nifty IT index has displayed a lot of resilience amidst the recent volatility. Though the IT index has to put in a lot more effort before one can consider fresh exposures, there are enough green shoots to keep a close watch on the IT sector. A breakout above 40,500 would be an early sign that there is sustained buying interest creeping into this sector.
To summarize, it is time to be cautious and await fresh clues from the price action before taking any decision about enhancing equity market exposures. Keep an eye on the support and resistance zones mentioned earlier and also watch out for how gold is performing. Unless 25,400 is taken out, we would recommend a cautious approach, focusing more on managing the existing portfolio rather than looking at fresh entries.


2 thoughts on “Technical outlook: Time for caution in the Nifty 50?”
Hi Krishnakumar ji, some insights on Silver pl, it’s making ATH, is it better to switch to silver from gold?(Considering gold vs silver ratio)
Hello Srikanth:
We will soon share our detailed outlook on gold & silver. Watch this space.
Regards
B.Krishnakumar
Comments are closed.