The author is an external contributor. Views are personal and do not reflect the opinion and views of PrimeInvestor.
For this technical update, we decided to focus on the Nifty 100 index instead of Nifty 50 index, as our index of choice for analysing the overall market sentiment. We decided to do this because of the confusing signals from the Closing Auction System introduced on August 3, 2026.

Along with the outlook for the Nifty 100 index, we shall look at the promising sectors and market segments. And a quick technical outlook for the S&P 500 index and the Nasdaq 100 index as well.
Nifty Short-Term Outlook
Before we share the technical outlook for the large cap universe, let us look at a few data points that indicate an interesting transition that has happened in the past couple of months. Until September 2026, the broader market represented by the Nifty SmallCap 250 index and the Nifty MicroCap 250 index were outperforming large cap stocks.
The Nifty 100 index lost 5.9% in September 2026 while the Nifty MicroCap 250 index lost a meagre 1% and the Nifty SmallCap 250 index 3.08%. But there was an interesting role reversal that happened in October wherein the Nifty 100 index gained 1.04% while the SmallCap and MicroCap index lost 5.78% and 8.94% respectively.
This is a clear shift in market preference towards the large-cap universe suggesting a turn towards risk aversion. Such behaviour is also evident from the relative underperformance of indices such as Nifty Alpha 50 and Nifty High Beta 50 in relation to the Nifty 100 index.
This is a clear sign that the market sentiment is shifting towards the large cap universe. Let’s take a quick look at the weekly chart of the Nifty 100 index featured below.
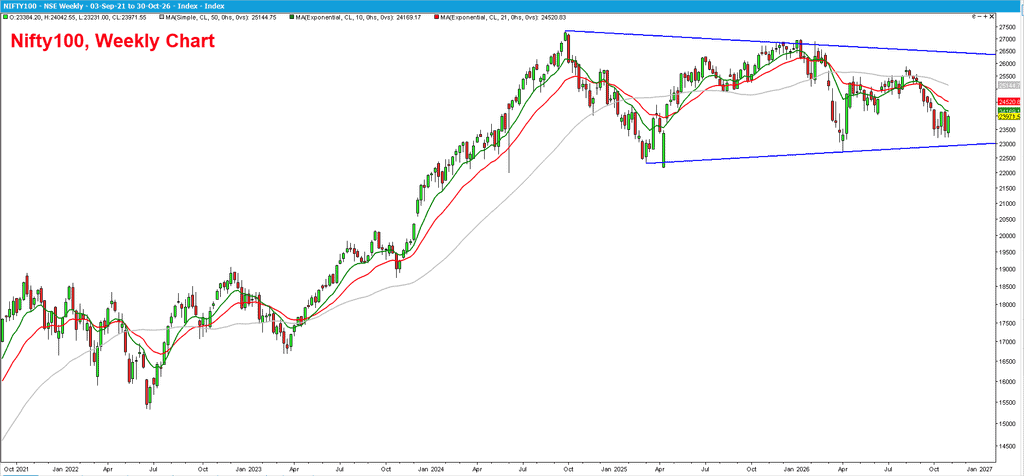
As highlighted in the chart above, the Nifty100 is tracing out a triangle pattern and a breakout from this pattern will set the tone for the next directional move. The levels to watch out would be 23,000 on the lower side and 27,000 on the higher side.
From a short-term perspective, there is a case for the recent recovery in the Nifty 100 index to extend up to the next immediate resistance at 24,650-25,100 range. The recent recovery in the Nifty 100 breadth from oversold zone strengthens the case for this recovery to extend a bit further.
But there is still no evidence to justify an outright bullish stance for this market. The recent underperformance of broader markets and the overall consolidation in the large cap stocks suggest adopting a cautious approach. This is a stock and sector-specific environment wherein the traders adept at quick entry and exit may get rewarded for taking long trades.
Broader Market Outlook
We have been highlighting in the recent updates that small and microcap stocks were outperforming the large cap counterparts, and this theme was on until September 2026. There is marked deviation in October wherein the large cap stocks have outperformed at the expense of the small and microcap stocks. Have a look at the relative strength chart of the Nifty SmallCap250 index versus Nifty 100 index.
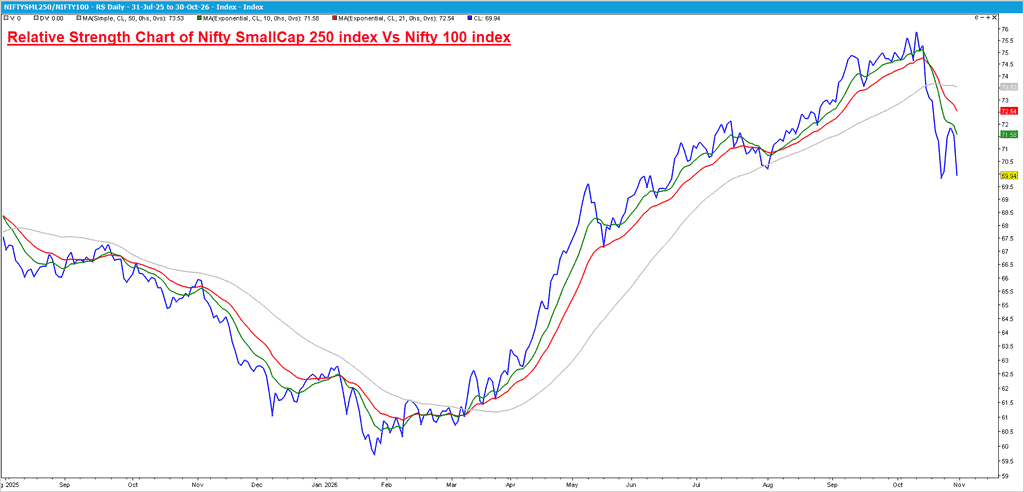
It is evident from the chart above that the SmallCap 250 index has been underperforming the Nifty 100 index in the past few weeks. Notice how this chart was trending higher since January 2026 suggesting relative outperformance.
For those willing in to put extra effort, we would suggest tracking the relative strength chart of the SmallCap 250 index and MicroCap 250 index versus the Nifty 100 index. There is no point turning bullish or considering exposures in the broader markets until there is recovery evident in these relative strength charts.
Sectors To Focus On
While quite a few sectors closed in the red in October, there were a few standout performers. The Nifty IT index was the joker in the pack. This Nifty IT sector has been a rank underperformer for several months. But there was a sharp recovery that happened in October, helping the index gain a whopping 18%.
A look at the price chart and the relative strength chart of the Nifty IT index suggests that the recent recovery may persist in the near term. The Nifty IT index could head to the next target of 37,500-38,000. This positive outlook would be invalidated if the index drops below the support level at 30,000.
The Nifty Pharma is another standout sector. The Pharma index is among the few sectors trading close to its all-time highs, suggesting bullishness. The Pharma index could head to the next short-term target of 28,500-29,000. Only a close below 25,100 would invalidate this outlook.
US Markets
Let’s turn to US markets which have been in the spotlight via the S&P 500 and the Nasdaq 100 index. The S&P 500 index is consolidating in the 7,500-7,800 range in the past few weeks. A breakout from this range is critical to impart the next directional move in this index.
A drop below 7,450 would be a sign of weakness and the S&P 500 index could then slide to the next downside target cum support zone of 7,250-7,300. The recent price action and the bearish sequence of lower highs and lower lows is indicative of underlying weakness.
The breadth indicators however are in the neutral zone and do not support bearishness. Given this dichotomy, it would be prudent to await confirmation before drawing any conclusion. Focus on the levels mentioned above and a breakout from these levels would determine the next major move in S&P 500. For now, caution is advised.
Similar to S&P 500 index, the Nasdaq 100 index too is confined to a broad range. The price has been moving within the confines of 27,000-31,400. But the recent spike in volatility and the breakout failure on the higher end of the range suggests short-term weakness for the Nasdaq 100 index.
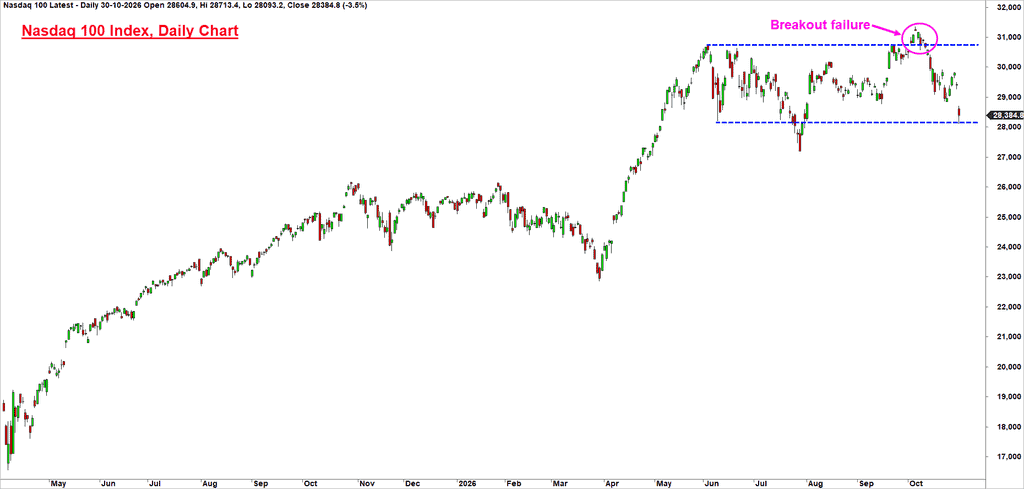
The Bullish Percent Index breadth indicator for the Nasdaq 100 index has flipped to a column of O, suggesting that there is a decline in the number of stocks which are in a bullish swing breakout structure.
To summarise, the outlook for the domestic and the US market is not convincingly bullish. In the domestic scenario, large cap stocks could see a short-term bounce while the broader markets might continue to struggle. In the US markets, it would be better to stay cautious as there is a possibility of further slide.