On December 1, you would have received text messages from various AMCs on the ‘Potential Risk Class Matrix’ (PRC) of the debt schemes you hold. If you’re worried about any change in risk profile of your fund based on this, you should read this article.
In June 2021, SEBI issued a circular that required AMCs to disclose the ‘maximum’ risk – both credit risk (arising from holding risky papers) and interest rate risk (arising from holding longer maturing papers) that each debt scheme can take. Once this is set, the fund needs to ensure that it does not breach this level. If a scheme’s holding moves to any higher risk category than this maximum level stated, it would amount to a change in the fundamental attribute of a fund and would therefore require AMCs to inform you and give an exit option.
This new rule of setting the ‘potential risk class matrix’ level was required to be disclosed by December 1. This is why you saw multiple fund houses sending you SMSes on this matrix with a link to their pdf.
Before we get into details of this PRC, let us place it in context by going back in history on how ‘product labeling and risk meter’ evolved over the years.
History of product labelling & risk definitions
Until 2013, there was no product labeling or risk profiling of mutual fund schemes. With mutual funds picking up as an investment asset class, the regulator found the need to highlight the risks associated with different schemes and hence introduced the concept of product labeling. Between 2013-2020, there have been several versions and improvisations.
While this did not necessarily make life easier for investors to understand what they were taking on in terms of risk and its suitability, it definitely reduced the discretion that was available to mutual funds to arbitrarily manage their portfolio for the sake of delivering performance.

#1 Go colours
In 2013, SEBI came up with product labeling for mutual funds using colour codes. Three colours – blue, yellow and brown, depicted low, medium and high risk respectively. The labels included details about the nature of the schemes such as ‘create wealth’ or provide ‘regular income’. All of these were to be decided by the AMC. This labeling broadly distinguished the risk level between equity and debt but did not help identify the varying degree of risks within each asset class. Do note that up until 2018, SEBI did not define any mutual fund categories nor where they could invest in.
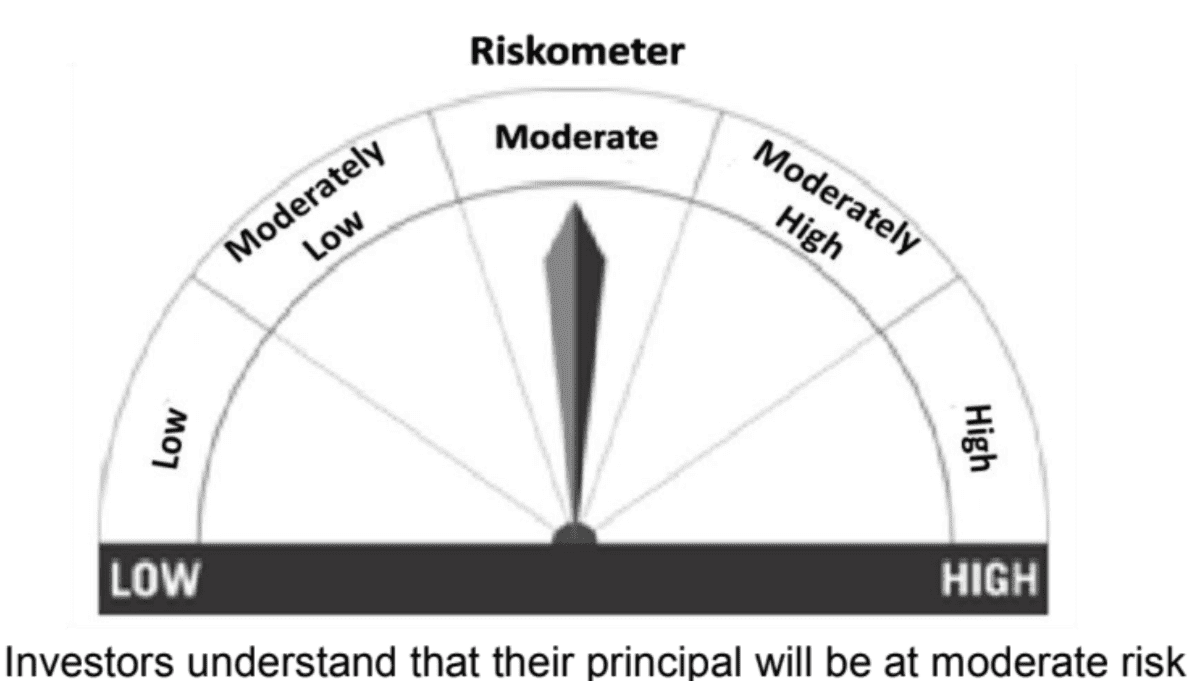
#2 Riskometer
In 2015, SEBI expanded these risk levels from 3 to 5 and also brought in pictorial representation of the risk levels. The image below captures the layers of risk that the meter is supposed to show. Here again, based on the best practice guidelines issued by AMFI (which is a mutual fund body), funds were allowed to label themselves based on the 5 risk levels.
#3 SEBI-defined categories
In the later part of 2017 (and effective mid 2018), SEBI introduced specific categories of mutual fund buckets into which the existing schemes had to fit themselves. A fund house could not have more than one scheme per category, barring exceptions like sector or index funds. SEBI also defined the universe/make up of these categories. For example, it defined where a large-cap fund could invest and what kind of instruments a corporate bond fund could hold.
While this was not a new product risk labelling, it allowed SEBI to indirectly cap the nature of risk that fund houses could assume in each category of schemes. This partly provided clarity on whether a fund would be suitable for an investor’s specific requirements. But here again, the debt space was a bit of a maze as credit risk was not clearly defined in many categories including ultra-short, low duration, short- or medium-term fund categories. That meant that funds could still pose as a short-term/low-risk scheme and hold credit risk.
#4 Dynamic Risk-o-Meter
In October 2020 (post the IL&FS saga in 2018 and then the Franklin liquidity debacle in March 2020), SEBI decided to have a new risk-meter that captures the risk of the underlying instruments in any scheme, rather than allowing fund houses to arbitrarily fit themselves into the risk-o-meter. In other words, it came up with a quantitative model to calculate risk in a fund.
The new risk-o-meter has 6 levels as given below:
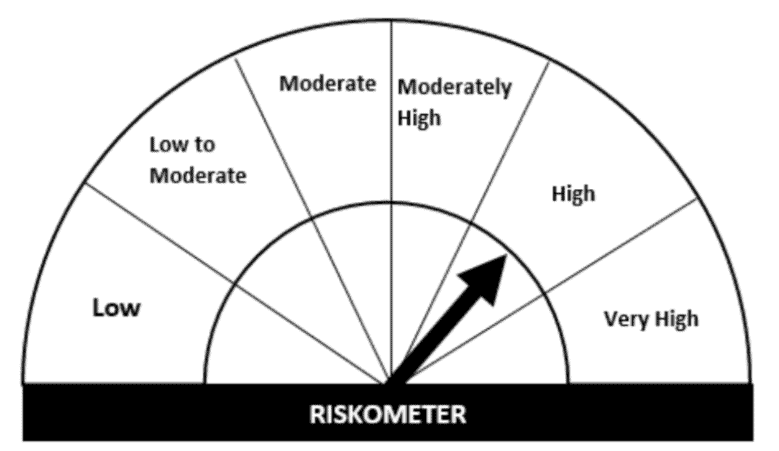
This new classification is very different from the earlier ones as it clearly spelt out a methodology for calculating risk. It provided the parameters and scoring to be considered for equity, debt and other types of instruments.
For debt, the risk parameters are classified as:
- Credit Risk
- Interest rate risk
- Liquidity risk
Credit risk is assigned values based on the highest to lowest credit rating of each instrument in a portfolio. For example, a AAA-rated instrument would receive a value of 1, AA+ instrument a value of 2, AA a value of 3 and so on.
Interest rate risk is captured based on Macaulay Duration of the portfolio.
Liquidity risk was based on whether the instruments were listed, unlisted or they had credit enhancements. These were weighted based on the percentage held in each instrument. The overall risk score was a simple average of the above 3.
For equity instruments the risk parameters considered are:
- Market capitalization (large, mid, or small-cap stock)
- Volatility (price swing of the stocks)
- Impact cost (liquidity of the stock)
The above parameters are weighted based on each stock’s or debt instruments proportion in the AUM and then the three are averaged to arrive at an overall score.
The regulator has similar risk methodologies or fixed scores for various other instruments from derivatives, gold cash, REITs, foreign securities and so on.
This is how the overall fund’s risk score and how the score fits into the Risk-o-meter looks like:
Since the portfolio disclosed by a fund can change every month, this risk-o-meter score can change if a fund changed the nature of its instruments in a month.
This is the new Risk-O-Meter that has been in force since January 2021.
This method was a significant improvisation over earlier ones as it did not leave any discretion for fund houses to fit their funds into any risk label. But it does have some peculiarities that we will discuss in the next point on the latest Potential Risk Class Matrix or PRC.

The Potential Risk Class SMS on December 1
The new Potential Risk Class matrix or PRC that we mentioned at the outset is not to be confused with the Risk-O-Meter we just explained. The Risk-O-Meter will continue to be stated for every product –equity, hybrid, and debt etc.
The PRC, on the other hand, is for debt funds alone and will simply tell you the ‘maximum risk’ that a debt fund can take. It will be a one-time disclosure now and further as an annual disclosure in the annual report or as and when it changes. Just to emphasize - the PRC is not the fund’s current risk, but the highest risk it is allowed to take. If the PRC changes, the fund needs to notify you and give you an exit option, as mentioned earlier.
Just to give you an example, we have picked a part of the notification you may have received from Axis Mutual, below:
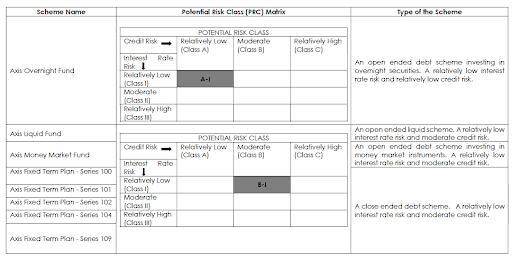
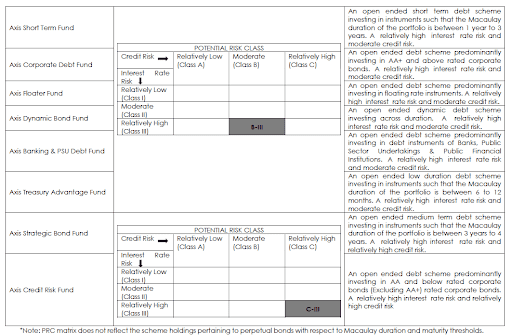
Let us try to understand what they suggest:
#1 Interest rate risk
This is nothing but the duration/average maturity (as depicted by a calculation called Macaulay duration) of instruments in a fund. The longer the duration, the more a fund is sensitive to price swings when rates move. SEBI has provided three buckets for this:
The above will be in the ascending order of risk – class I being the lowest risk class.
In the above Axis Mutual potential risk class matrix, you will see that Axis Floater has classified itself under class III in interest rate risk. That essentially means its underlying maturity of funds can be anything. That adds to its potential risk. This does not make the fund risky. It simply means that it CAN assume higher interest rate risk if it wants to, without your approval 😊
Now, take the case of the Axis Overnight or Liquid fund. You will see that their interest rate risk falls in Class I. That means their MD will be lower than 1. So, their rate risk is quite low.
#2 Credit risk
Credit risk is the risk of a fund’s instrument defaulting on its borrowing. Based on credit rating agencies’ rating, SEBI has defined the risk as follows.
The above will be in the ascending order of risk, Class A being the lowest in credit risk. CRV or the credit risk value is the highest for the most credit worthy instrument and least for instruments with very poor credit rating. The values assigned for each rating is given below.
Let us take the same examples as we took earlier. Axis Floater is classified as Class B or moderate risk in terms of its credit. Overall, it is in B-III – that is, moderate in credit risk (class B) and relatively high in interest rate risk (class III).
A fund that is in Class C of credit risk and Class III of rate risk would have the highest potential risk.
What’s tricky about the PRC?
The idea of giving the PRC is for you to know the maximum risk that a fund can assume. So, when you choose funds, you are aware that it can take more risk than what the Risk-O-Meter actually states.
For example, Axis Floater’s Risk-O-Meter states ‘low to moderate’ but its PRC states that it can have a potential high interest rate risk.
Is the interpretation this simple? Actually, NO!
First, some funds that may appear risky may not really be! Let us take the case of SBI or Aditya Birla Sun Life AMCs. The liquid funds from these AMCs have been placed in Class B of credit risk – that means moderate credit risk – and not Class A, which is low credit risk. Now, you would wonder how this can happen, since you expect liquid funds to have the least credit risk. Here’s the explanation: SEBI mandates that when a short-term instrument (with a short-term rating) also has a long-term rating, only the lowest long-term rating would be taken.
For example, if a commercial paper in a liquid fund has A1+ rating but AA rating over the long term, then the credit risk would be based on this AA rating and not the instrument’s actual A1+ rating. If there is no long-term rating, , then, based on credit rating mapping of rating agencies, between short term and long-term ratings, the most conservative long-term rating shall be taken for a given short term rating. Yes, we agree, it’s confusing.
To cut a long explanation short, that the liquid funds of Axis or ABSL are in Class B should not really worry you because their short-term instrument is assessed as being credit worthy and the money is expected to be returned in the short term.
Similarly, on the interest rate risk front, if you take a popular fund like Aditya Birla Sun life Floating Rate, it is classified as B-III – which means moderate credit risk and high interest rate risk. The gilt fund from the same house is A-III. Does this mean the floating rate fund can be as risky as the gilt fund in terms of interest rate risk? Unlikely, as the floating rate fund has simply classified itself as having ‘any Macaulay Duration’ like the gilt fund. But in reality, a floating rate fund is very different in the way it responds to rate changes when compared to a gilt fund.
Second, selection of funds simply based on PRC can lead to wrong decisions. For example, Axis Short Term Debt is in Class B suggesting moderate credit risk while SBI Short Term Debt is in Class A suggesting low credit risk. In reality, both funds have historically had low credit risk and Axis actually scores better on many other performance metrics. Hence, using PRC alone for choice of funds may not be prudent.
The Potential Risk Class matrix, therefore, can get very confusing due to the anomalies above besides its potential clash with its existing Risk-o-meter.

What should you do with the PRC?
The PRC can give you a fair idea about the maximum possible risk that a fund can take. However, taking a call to exit a fund based on this matrix or a call to buy a fund purely based on the matrix is best avoided for the reasons we mentioned above. It is not a simple conclusion much as SEBI may try to make risks clear.
The best way to assess a debt fund’s portfolio risk is to look at the current portfolio and do a periodic review of the portfolio. The monthly Risk-O-Meter will also help you in this. If you are with PrimeInvestor, you can take comfort from the following:
- Our Prime MF Rating already considers both credit and duration risk (depending on whether a fund is accrual or duration based) that the Risk-O-Meter uses with respect to debt funds, and will therefore largely reflect the changing risk in any fund, on a quarterly basis. For example, a medium duration fund such as Kotak Medium Term with Class C score(high credit risk) currently has a Rating of 2 stars in Prime Ratings based on its current portfolio. Prime Ratings goes one step further and also has a low rating of 2.5 stars for a fund like ICICI Pru Medium Term which comes under Class B (moderate credit risk) in PRC. This fund, although it is classified as moderate risk under PRC, has a relatively higher credit holding than its peer set. Our rating captures this even while the PRC may not tell you how it compares with peers on a relative scale.
- Our MF review tool calls out funds in very short and short duration spaces that carry higher credit risk in the comments column (and where necessary, we do mention minimum investment timeframe needed as well, where it may be at odds with its category).
- Our Prime Funds are picked only after considering the risk profile every quarter.
- We have a MF Screener in the works (to be released soon) that will actually allow you to see the % of AAA, AA+, gilt etc. rated instruments in debt funds, or the % of large cap or midcap in equity funds. This data will be based on monthly disclosure of fund houses and will therefore help you keep tab of risks in your fund or help you filter funds based on risk.
Simply put, we make it easier for you to navigate this complex structure and provide simple, effective solutions. Therefore, don’t get unduly worried about those SMS messages!
P.S: We do see a potential risk as a fall out of the PRC though. That is the risk of the AMC teams working hard to comply with the complex disclosures on Risk-O-Meter and PRC at the cost of time spent in managing actual risks in portfolios and managing performance of your funds. That was on a lighter note folks 😊Perhaps fund managers can tell us!


3 thoughts on “Potential Risk Class matrix for debt funds – what should you do?”
Hi Team PI,
Nice explanation on PRC. Most mutual fund prefer wider mandate for ease of navigation .. so, I think, PRC is a wasted exercise. Tracking the historic risk levels taken by a scheme would help better in understanding the approach of the fund manager. Amidst PRC conundrum, PI’s MF Screener is much awaited.
Further, as you say .. any -ve changes in PRC would allow investor a penalty less exit from the scheme, in the same way .. any increment in TER too should allow free exit to the investors
Regards .. Jatin Mehta
The more things change,the more they remain the same. This initiative by SEBI thought well-meant will cause more harm than good ( assuming a sizeable number do read the documents). Perhaps a better approach would have been to publish the current risk score against the benchmark. However some of the statements in the SID are so vague ( atleast to me ) that defining the maximum risk(benchmark) would itself be a chore.
Your MF screener is highly awaited now 🙂
Nice Article Vidya btw.
Thanks
Well-said 🙂
Thanks! Vidya
Comments are closed.