The author is an external contributor. Views are personal and do not reflect the opinion and views of PrimeInvestor.
In the previous update (technical outlook for 2024) on the Nifty 50, we had shared a bullish view for the index and had mentioned a short-term target of 21,800-21,950. The index has both remained bullish and reached this target zone.
The key question now is – what next? In this post, we shall tackle this question and cover the short-term outlook for the Nifty 50, along with a few sectoral indices.
Nifty 50 short-term outlook
Here is the daily candlestick chart of the Nifty 50 index.
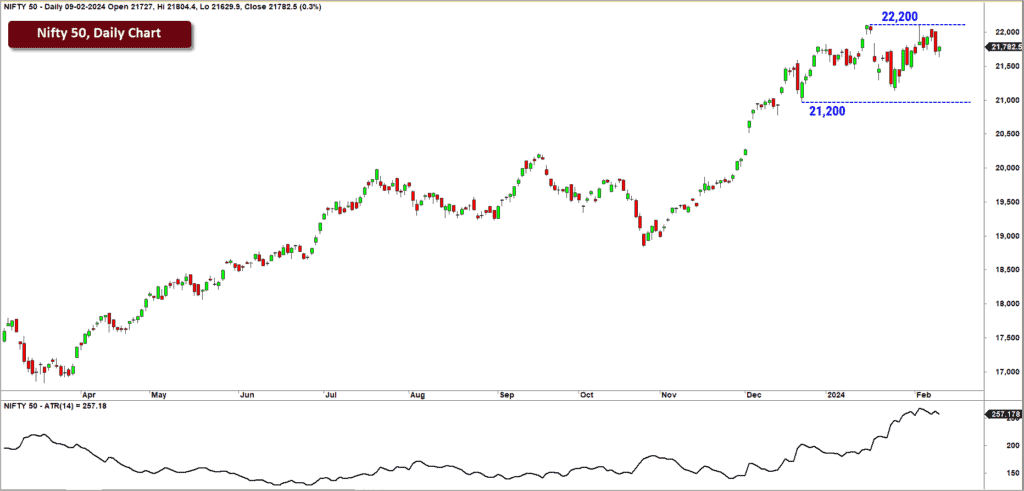
As highlighted in the above chart, the price has been confined to a broad range of 21,200-22,200 in the past few weeks. The price action has been marked by a spike in volatility too. The 14-day Average True Range (ATR) indicator is plotted in the lower pane of the chart. This indicator is at elevated levels, confirming the spike in volatility.
But though volatility has increased, the price action has been bereft of any momentum. Therefore, it remains to be seen whether the heightened volatility and lack of upside momentum is a precursor to the much-needed downside correction in the Nifty 50 index. A look at the chart does not suggest any signs yet that price could get into a deeper correction.
A fall below the recent swing low at 21,200 would be an early sign of a deeper correction. A breakout above 22,200 would indicate the possibility of a further rally in the index. Until either of these levels are broken, expect the recent volatile and range bound price action to persist.

Let us look at the breadth indicator to glean further insights about the current technical picture. We will use the reliable PF-X% breadth indicator to assess the overall health of the market. This breadth indicator in 1% box size (capturing short-term breadth) is currently in the neutral zone.
Though the indicator is currently not in the overbought zone, there is a glaring negative divergence between the Nifty 50 price movement and the breadth indicator. This breadth indicator has been making lower highs since mid-December even as the Nifty 50 index has marched higher. This indicates narrowing of participation among the Nifty constituents. In other words, the index has remained afloat on the back of a fewer stocks, which is not a healthy sign.
This breadth indicator in the bigger time frame has just commenced a cool off from the overbought zone. It is interesting to note that the breadth indicator has not yet the hit oversold zone for over six months now. To put this in perspective, a the cool off in the breadth indicator can happen via a price action in the Nifty or through volatile sideways price action.
The recent price action suggests that the cool off is happening through the volatile sideways mode. A breach of 21,200 would indicate that the price correction mode is underway, which could lead to further cool off in breadth. For now, focus on the levels mentioned and we shall update revised targets when 21,200 or 22,200 is breached.
Let us now switch focus to the broader markets.
Nifty MidSmallCap 400 Index
The broader markets have been firing all cylinders for almost a year now. While there is nothing bearish in the price chart, there are a few red flags that one needs to take note of. Featured below is the daily chart of the Nifty MidSmallCap 400 index along with the breadth indicator in the lower pane. We have used the percentage of stocks that are trading above their 50-day moving average as an indicator to measure market breadth here.
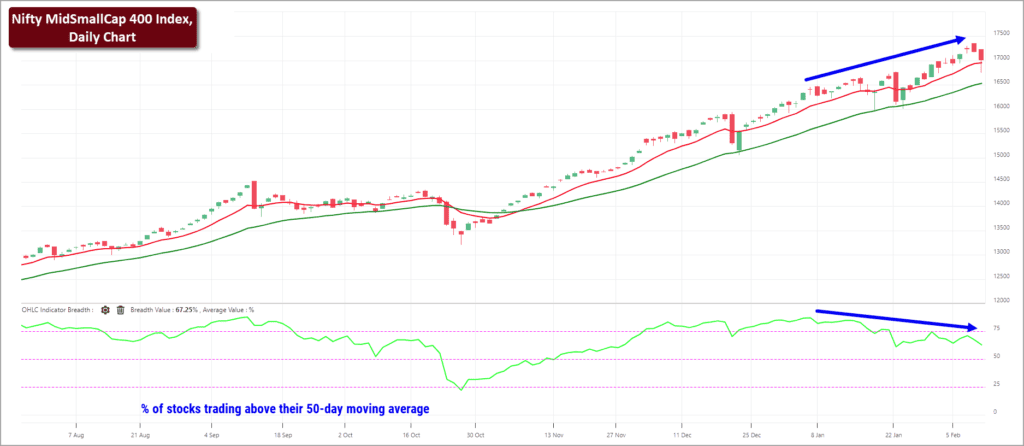
As highlighted in the above chart, while the price has been making higher highs, the short-term breadth indicator has been drifting lower. This is a classic negative divergence suggesting thinning of participation which is a typical sign of exhaustion.
But the price action or the relative performance chart is yet to turn bearish. A fall below 15,900 would be a sign that the broader market is headed for a serious cool-off. Price-wise, the recent rally has pushed the index into an overbought zone, justifying the case for a cool off. But remember that price can remain overbought for an extended period; it just has to revert to mean sooner than later.
Instead of second-guessing the correction, it makes sense to be prepared for one if it happens. The best way to prepare for an eventual correction or a mean reversion move is to focus on a clearly defined exit plan. We cannot emphasize enough about the importance of the exit plan. Remember, all major correction in price begins as a harmless correction and then morphs into a deeper cut. A logical exit plan, that is in sync with your investment objective, will be helpful in exiting at the appropriate time and thereby avoiding the pain of a correction.

Now, let us take a quick technical look at other influential sectors.
Sector indices
Nifty Bank
The lack of outperformance from this influential index has been a glaring feature of the bull market witnessed since March 2023 lows. This index has a big influence in the performance of Nifty 50 index and unfortunately, the Nifty Bank index has been a terrible underperformer versus Nifty 50 since mid-July 2023.
There are still no signs of a reversal in this relative underperformance. The technical picture in the Nifty Bank index is not as bullish as Nifty 50. The Nifty Bank index is tracing out a bearish sequence of lower highs and lower lows in the past few weeks. This index has to close above 49,000 to harbour any bullish hope. A fall below the recent low of 44,300 would indicate that the index is headed to further lows.
Keep an eye on this index. Any signs of bullishness along with relative outperformance would indicate that Nifty 50 index could march higher and probably reach our 2024 target of 24,000+ sooner than later.
Nifty IT
We have been highlighting that this Index is showing early signs of bullishness, after several months of relative weakness. The price action in January has been constructive and reinforces the merging bullish stance towards this space.
The outlook will be bullish as long as the Nifty IT index sustains above the 34,000 level. The near-term target for the Nifty IT index is 43,000-43,500 and the chances of a rally to this target zone would be invalidated only on a breach of 34,000.
Nifty PSU Bank
This index continues to be a star performer. After a temporary blip in November & December, this index bounced back smartly in January. As observed in the previous update, the breakout above 5,950 was a sign of bullishness and the index has powered ahead to current levels of 6,944.
The trend in this index remains bullish and there are no signs of a reversal in the relative outperformance either. Remain invested in this sector and use any price correction to build exposures. Only a fall below 5,500 would be a cause of concern and would warrant a cautious approach towards this sector.
Other Sectors
The Nifty PSE /CPSE space remains hot and the stocks from this universe have witnessed euphoric moves recently. Most of the stocks from the sector are extremely overbought and are vulnerable to a significant price correction. The risk-reward equation is not favourable to justify fresh exposures in stocks from this space. Wait for a cool off and take a look at fundamentally strong and relatively undervalued stocks for investment.
To summarise, most sectors and indices look overbought based on price action. There are signs of thinning of participation when one looks at the breadth indicators. This is not an environment to be aggressive in taking fresh exposures. Ideally, you must be fully invested by now and enjoying the bull run. Of course, do not get carried away and focus on your exit plan.