The top-used product at PrimeInvestor, our MF Review Tool, is good for anyone who wants to know our call on your fund (buy/hold/sell) and the reason for the same. It also helps you pick the funds we have a buy on, if you want to go beyond Prime Funds.
But for those of you who want to see the evidence backed by data or wish to do your own filtering, then Prime MF Screener is the only tool available today in town for you to do this evidence-based investing (for those of you who are not Prime subscribers, register today to check out this tool).
If you are a subscriber – well, what’s stopping you from empowering yourself using our MF Screener to pick good mutual fund schemes?

So, here, we will explain how you can get the most out of this one-of-a-kind tool, how to screen and pick funds. If you are entirely new, you can go through the following to familiarize yourself with how to use the Screener.
- This guide will explain how to use the screener
- This guide will tell you how and for what purpose to use our pre-built screeners
#1 Performance data
When you assess a fund, performance metrics score over everything else. Sadly, whether it is the factsheet or the way data is presented on most websites, it is the point-to-point returns that attract attention instead of the lesser-known but far more important rolling return, which tracks the entire journey of a fund’s performance.
(You can understand more about rolling returns and why it’s superior to point-to-point returns here: Three things to know about mutual fund rolling returns)
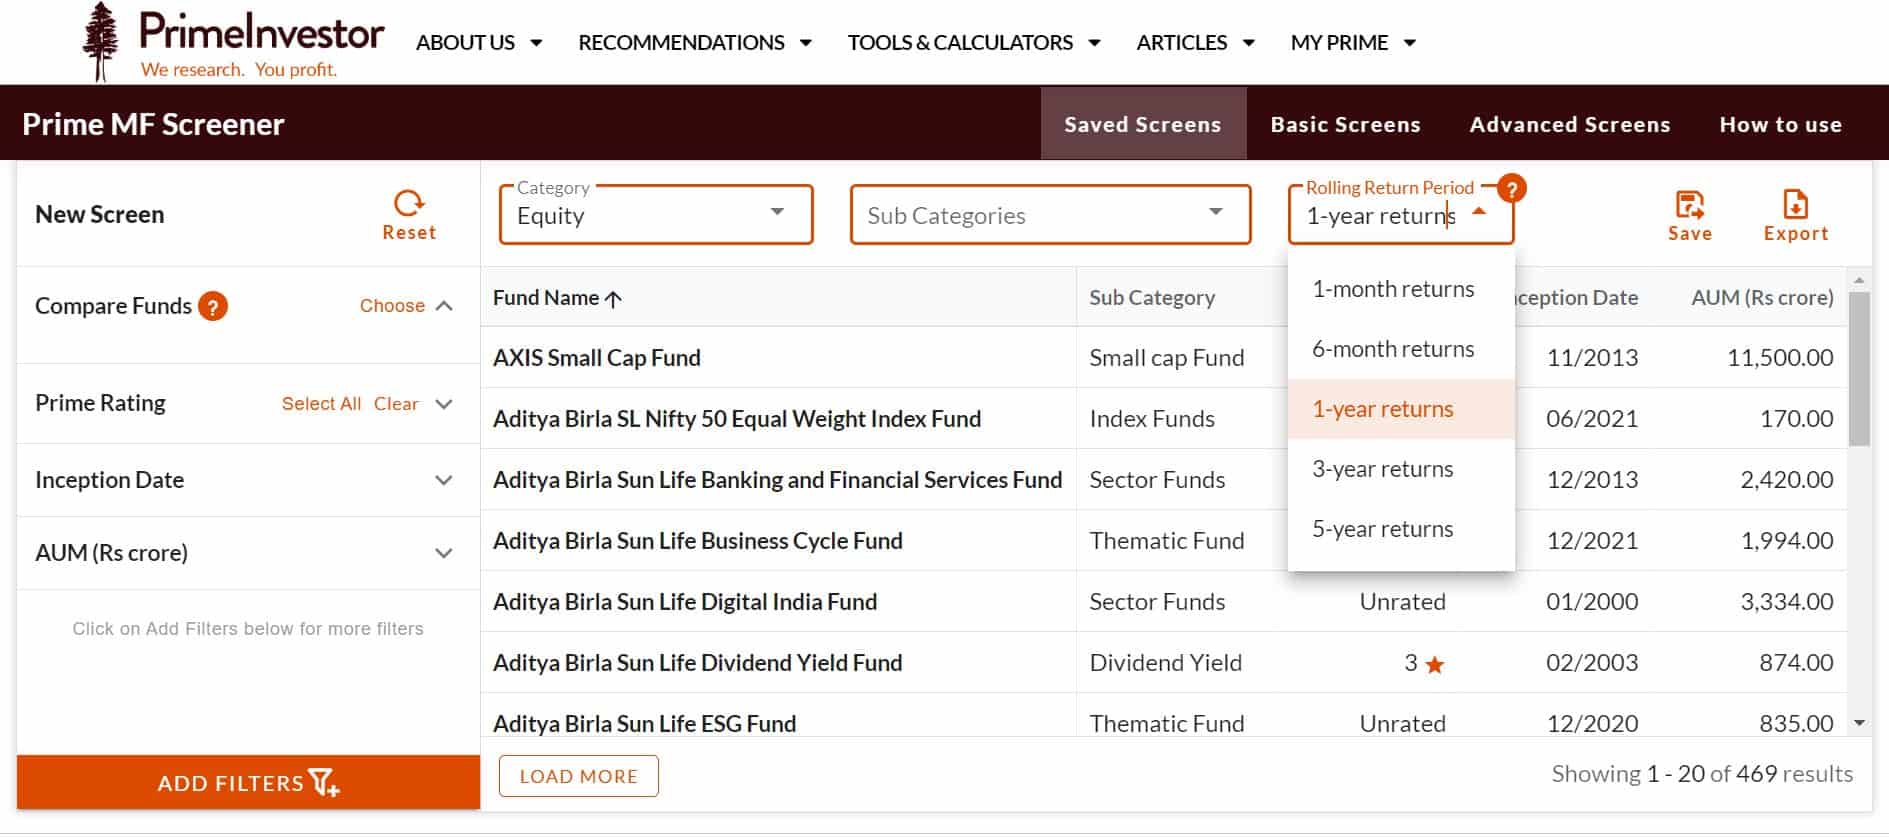
In the Prime MF Screener you will see an option to choose your category, sub-category and then the rolling return period (see image below).
Step 1- Choosing the return time frame: The rolling return period is the return time frame you choose – whether you want 1-year returns to be rolled daily or 3-year returns to be rolled daily and so on. We would recommend you go for a 1-year and 3 -year for any long term product – be it equity or debt. You might wonder if that is not a short period.
The reason is that a 5-year rolling returns may entirely mask recent years of underperformance. A rolling 1 & 3 year gives you the ideal mix of knowing longer period performance and any shift in performance in the shorter period.
And do remember, for a 3-year rolling return, the total period under consideration will be 6 years (3-year returns rolled over 3 years) – so you have taken a long enough period.
You can always look at longer record (if there is one) with the 5-year option, for additional evidence of performance.
For shorter duration products 6 months and 1 year should be good. The 1-month rolling is suitable for very short duration debt funds and arbitrage funds or low-risk hybrid like equity savings.
Step 2 – Assessing return metrics: Once you choose the category and the rolling returns period, you will be able to choose performance metrics for that rolling return period. While there are multiple metrics, they can sometimes provide contradicting signals.
For example, a fund may show low Sharpe but high Sortino and you will be left wondering which one is better. This is because while the Sharpe uses the standard deviation (upside and downside volatility) to measure risk, the Sortino looks at only downside deviation. Hence the deviation 😊
To keep it simple, Go to filters > choose performance and consider using just the following:
Do remember to download the data in excel so that it is easier for you to look at the top quartile. And yes, they don’t need to be chart toppers!
Step 3: Assessing risk metrics: Risk metrics are necessary, especially in high-risk equity categories or debt funds where volatility is high. And they are even more important when you are choosing certain categories - such as balanced advantage/dynamic asset allocation or equity savings, where one of the primary objectives is to reduce downside risks.
In this, we think 3 simple metrics would suffice to assess risk:
- Standard deviation: lower the volatility, the better
- % instances of losses: Lower the proportion of times your fund gets into losses, the better.
- Minimum return: Useful to know the worst performances, especially in debt funds.
In the image below, you will find that while the Quant Midcap fund sports lower instances of losses, its minimum return is worse than the Nippon and PGIM funds. That means that its worst returns can be bad but the number of times it gets into the negative zone is low.
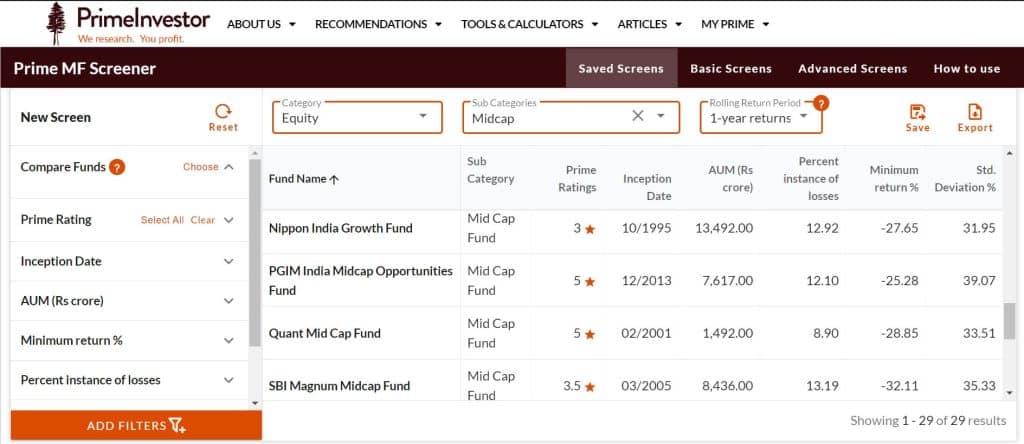
Interestingly, you will see that the standard deviation is quite high for the PGIM fund but its proportion of losses is not high. Its worst return is also better than the others. This indicates that the fund does swing a lot (deviation), but likely more on the upside.
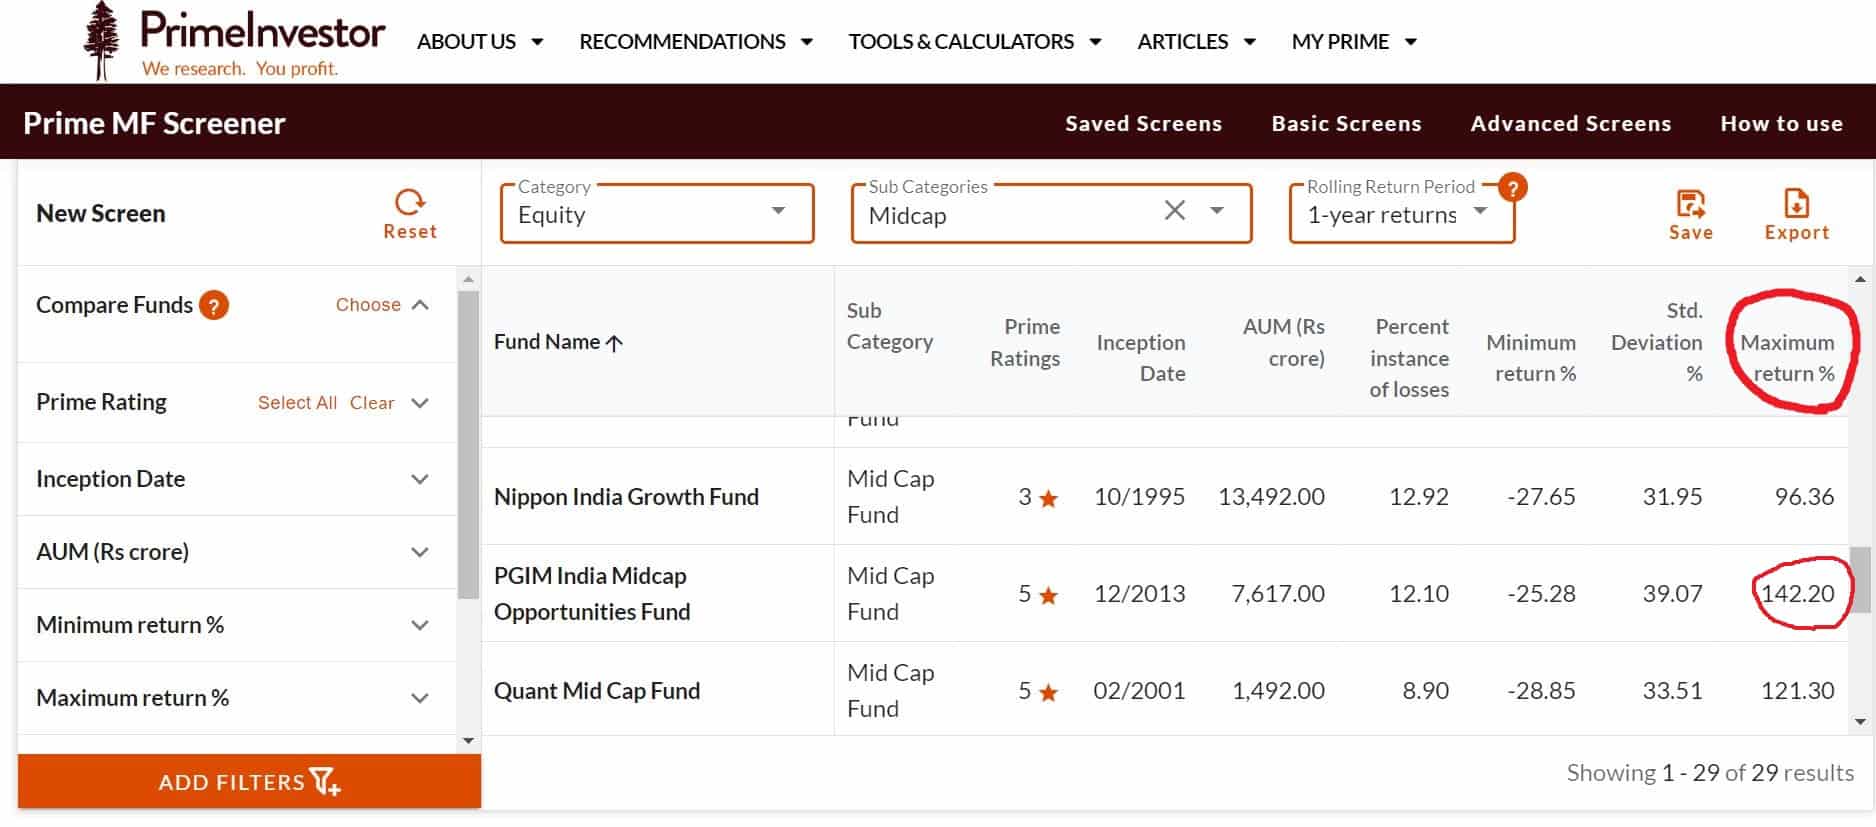
Let’s add the maximum returns (in the said rolling period) to see this. The image below tells you that PGIM indeed scores high on maximum returns. Chances are that the high standard deviation is more due to high upside. In other words, you will understand that the standard deviation per se is not a terrible thing for this fund.
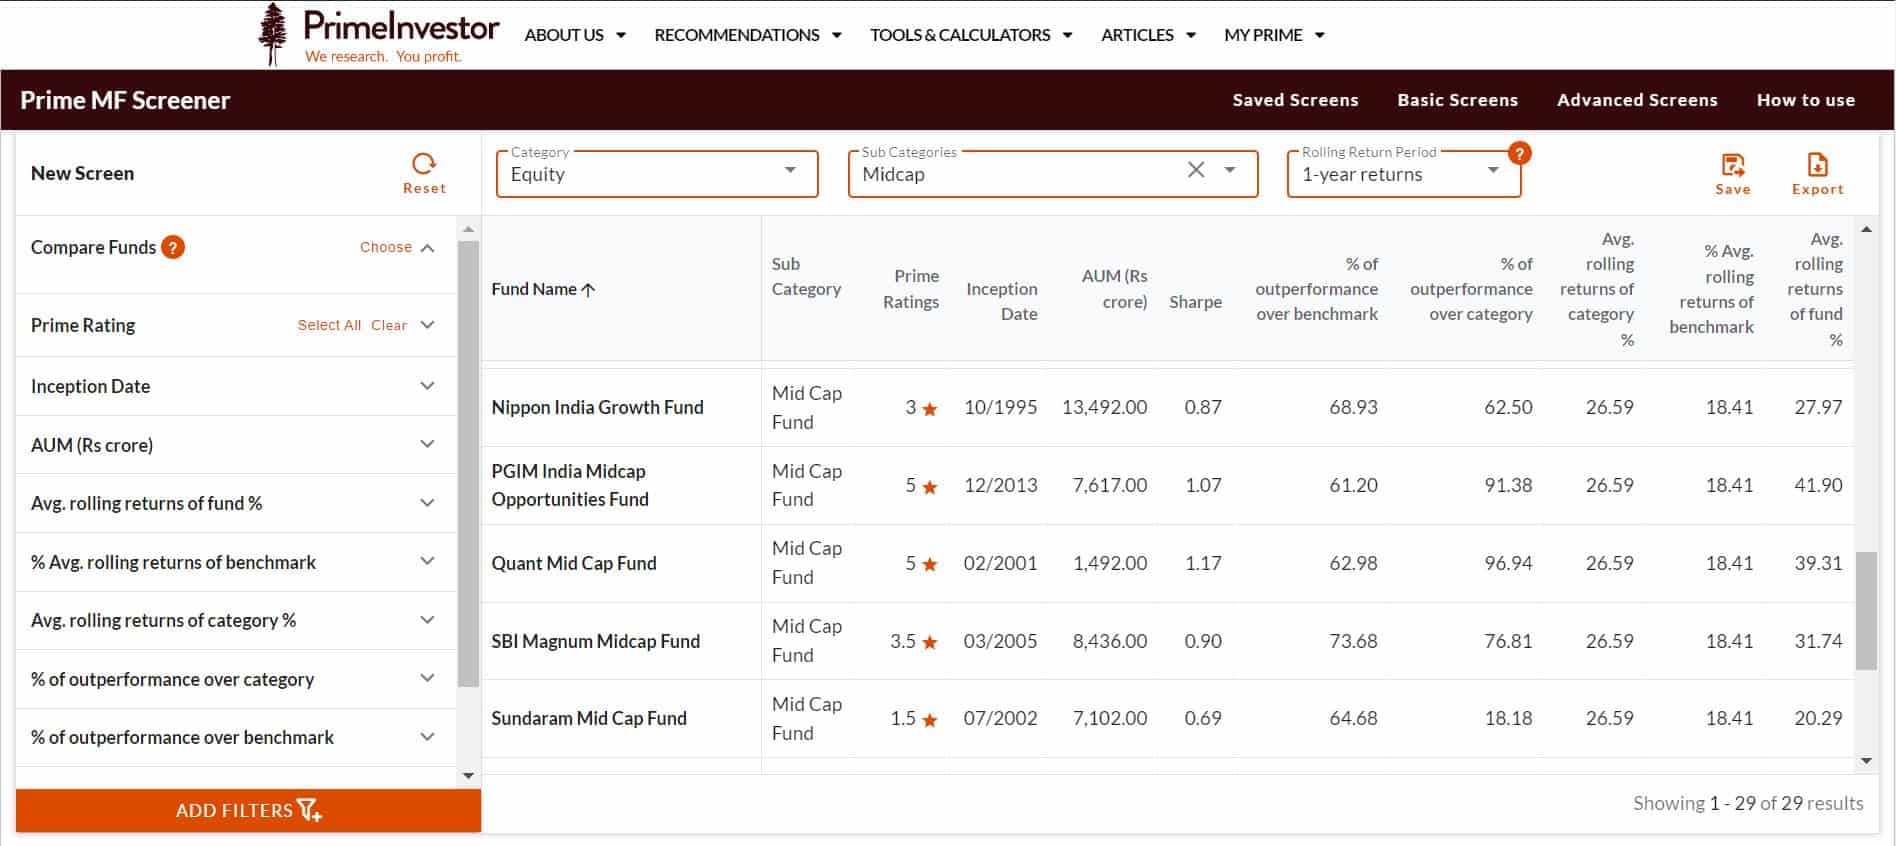
Now let’s go back to the return metrics we discussed earlier and see how it stacks up for the same set of mid-cap funds above.
The image below tells you that Quant has a high Sharpe and high percentage of outperformance over benchmark and category, closely followed by PGIM. The same funds showed superior traits in risk as well. You can add all of such risk and return metrics in one filter and look at them together for easier interpretation.
#2 Portfolio data
Once you have seen data relating to risk and performance, there is another set of data to assess strategy and risk. This set of data will tell you where the returns came from and allows you to decide whether you want to take on the kind of risk that delivered such returns.
Portfolio data can be easily viewed with Prime Screener. Choose your category and sub-category (rolling return is irrelevant here, so you can choose any), click ‘Filter’ and go to ‘Portfolio’.
Equity fund portfolios: For equity funds, market-cap holding - such as large/mid/small - sector and stock concentration, and cash holding can be checked with the Screener.
You will find in the image below (for multi-cap funds) that LIC Multicap is more aggressive than the others with lower allocation to large caps and higher holding in mid and small caps compared with peers.
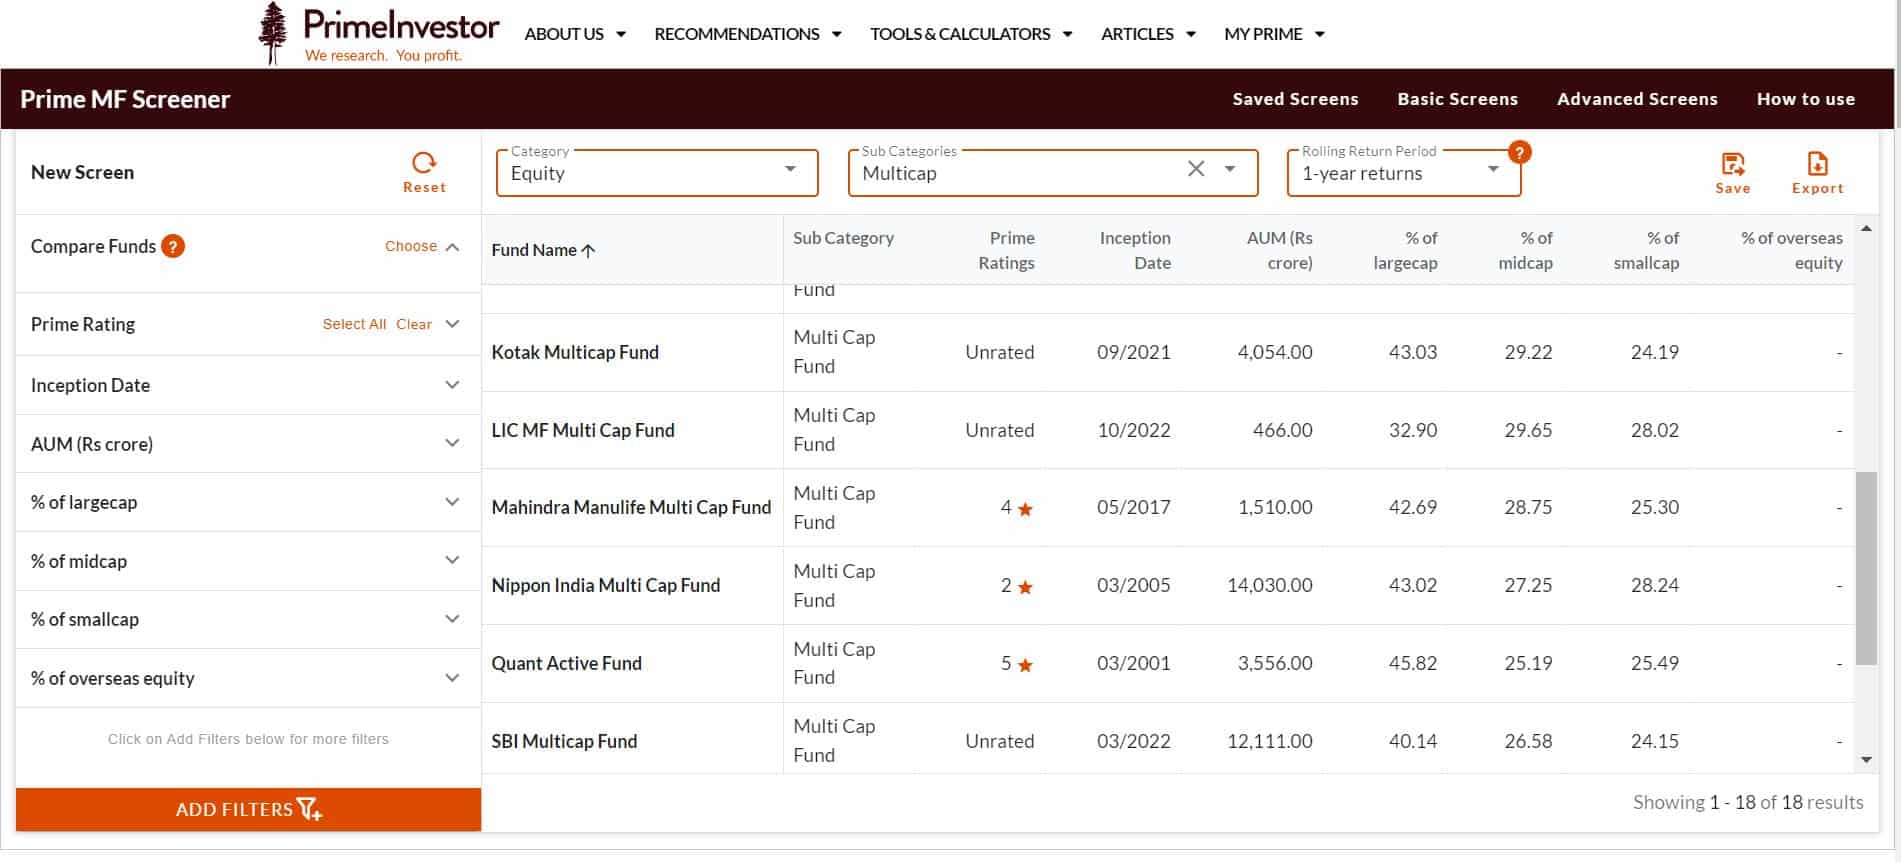
If you need pointers on what to look for in equity funds in this filter, it can be (not restricted to):
- % of large cap, % of mid cap, % of small cap – needs to be seen in the context of the fund category.
- Cash equivalents – too much for too long is not a good thing
- Portfolio turnover – higher churn shows tactical investing or an overhaul in portfolio
Debt fund portfolios: In debt, portfolio data can be vital in terms of understanding the duration as well as the credit risk of funds. Let us suppose we take medium duration funds. In the image below, you will find that the ICICI Pru Medium duration has a high YTM (yield to maturity). This may quickly bring you to a conclusion that it is a superior fund. However, that it has higher risks attached to it will become evident when you look at its holding % below AA+ (at 32.8%).
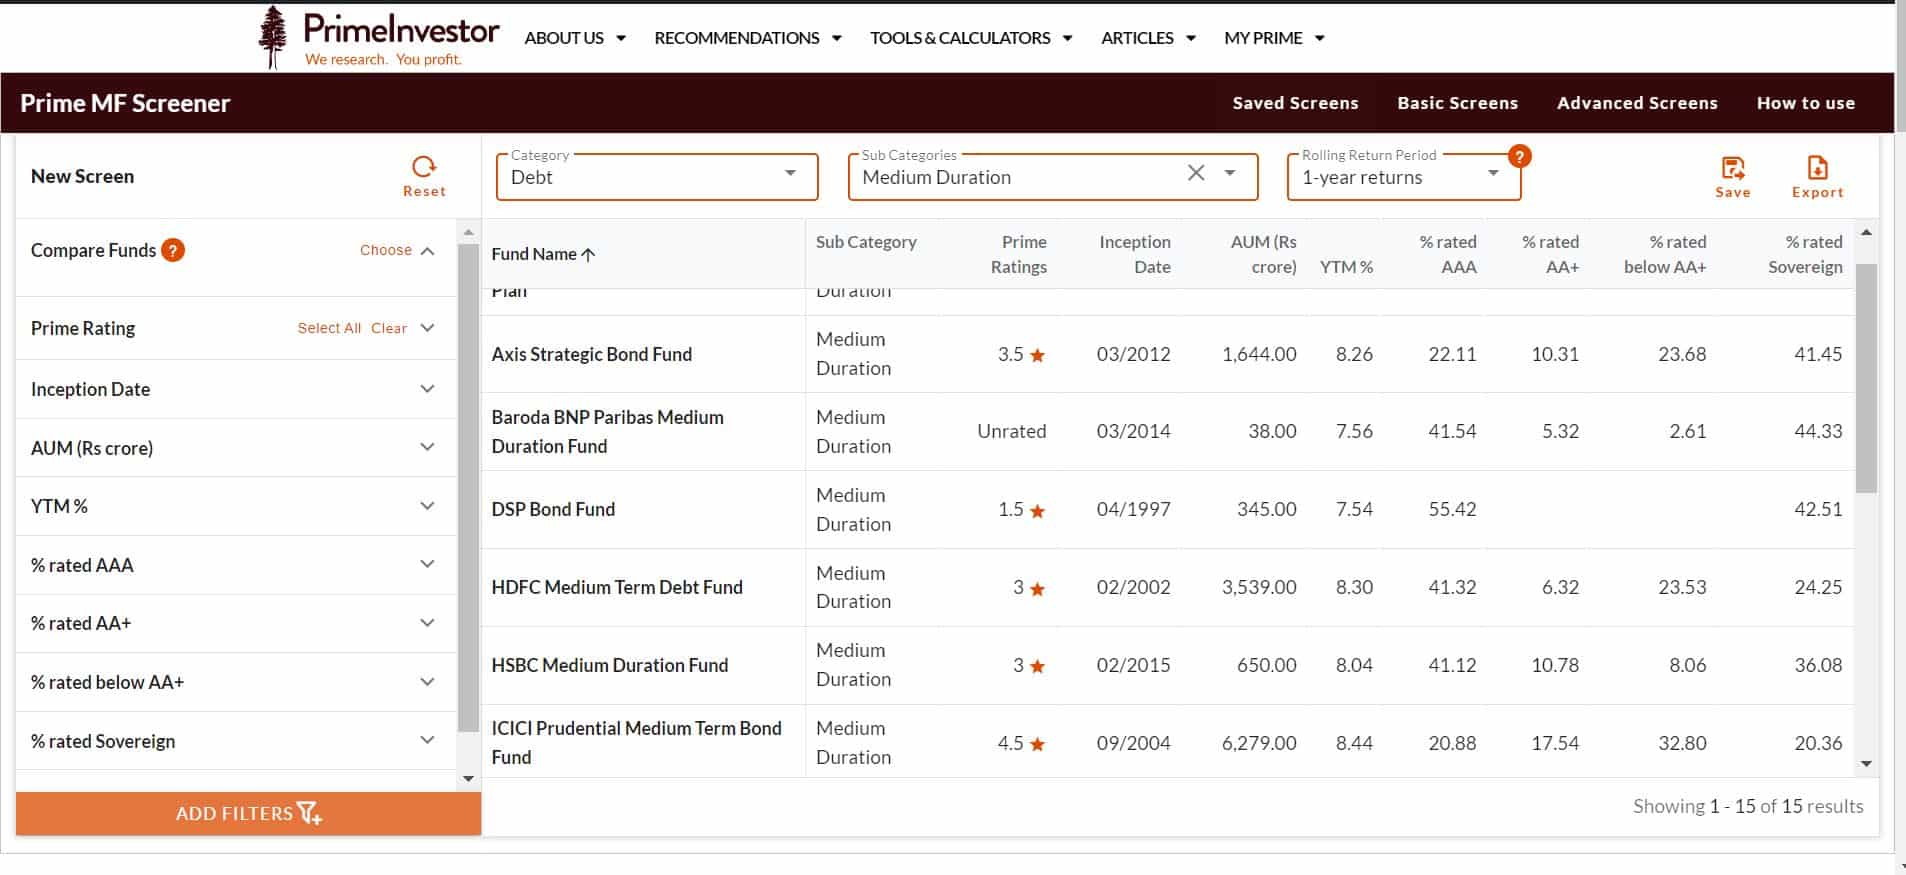
When it comes to data such as average portfolio maturity, there may be funds within categories (such as floating rate, dynamic bond, or even short duration) that sport varying duration. Hence, its return prospects as well as suitability for your time frame should be judged taking the maturity into consideration.
Here data relating to the following would be the ones to look for:
- YTM – higher the better subject to the credit risk and your ability to take it on
- Average maturity – if it is not inline with category, make sure it suits your time frame. In general, higher duration poses risk of more volatility in the short term and requires a longer holding period.
- Credit holding – higher risk in categories that do not warrant high credit risk (like ultra-short or short) means enhanced risk. When you choose funds with high YTM, this is a primary factor you need to be aware of.
Hybrid fund portfolios: When it comes to this category, the equity-oriented ones can be assessed like equity and the hybrid conservative can be assessed like debt. The interesting part here is the hybrid funds with derivatives. Here, a fund’s risk can be assessed from the hedging it does.
This is why at PrimeInvestor, we have a separate classification of hybrid category with derivatives to provide this data that might otherwise not be easily available elsewhere.
Look at the image below:
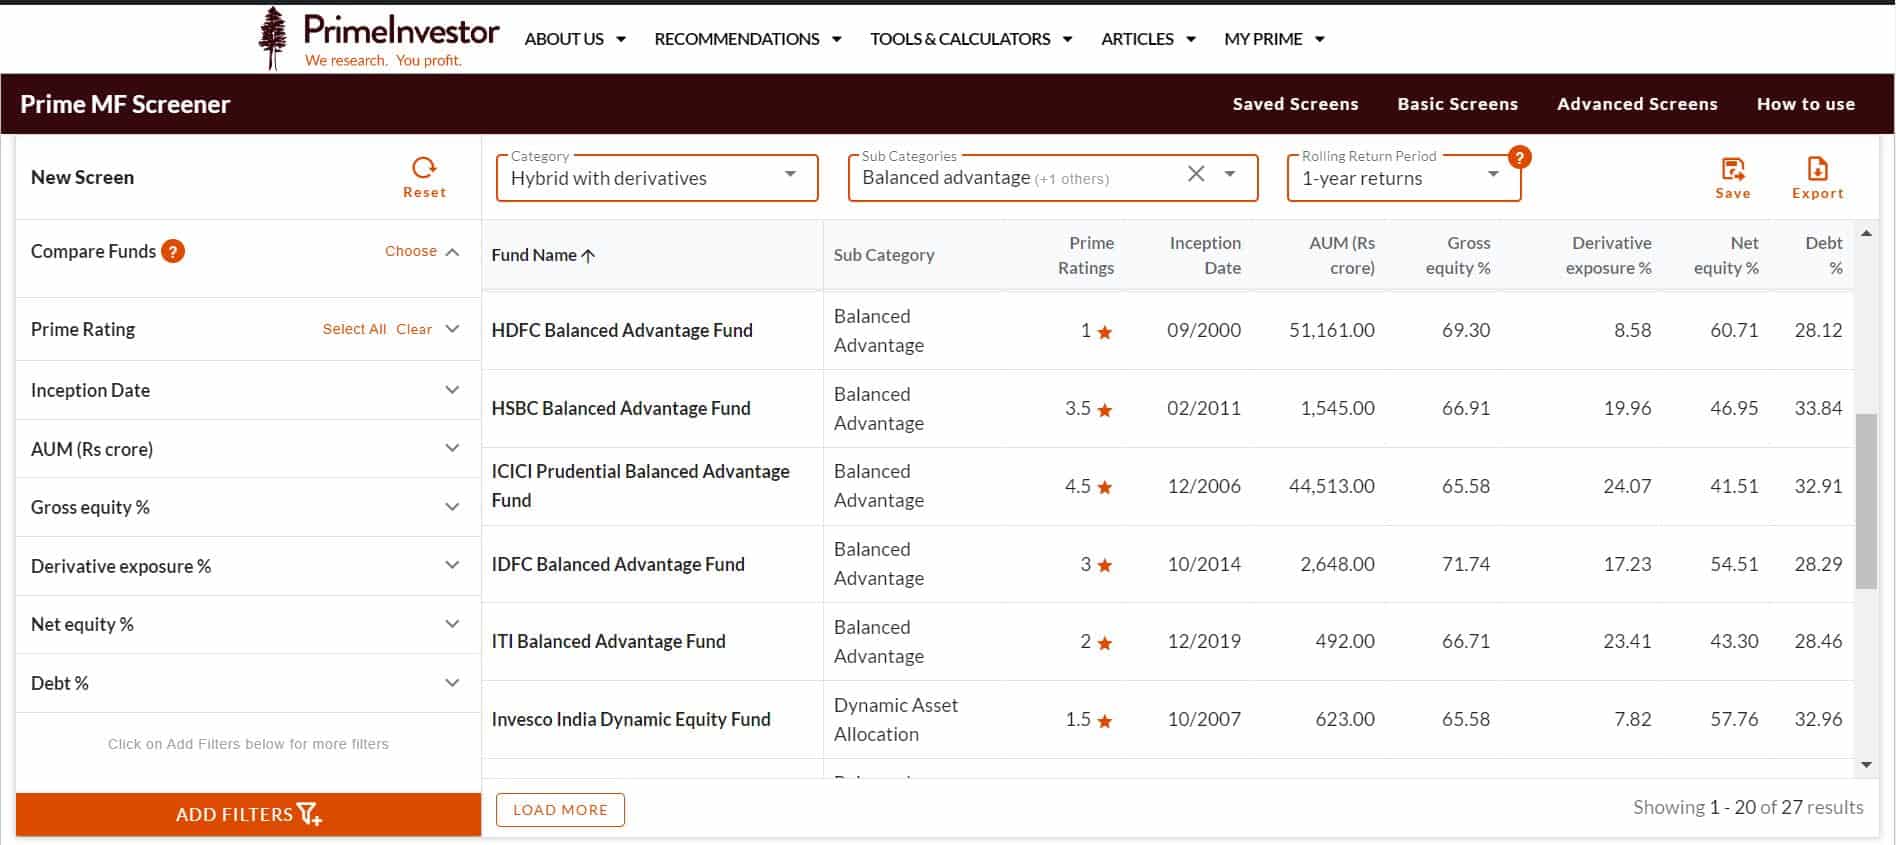
You will notice that HDFC Balanced Advantage has far higher net exposure to equity (low hedging) thus making it a far riskier fund that peers such as ICICI Pru Balanced Advantage. In a rallying market, naturally, a fund with higher equity exposure will do well.
If you looked at the returns and not at where the returns came from, you might end up picking the wrong fund in a category which is supposed to keep your risks low.
In this category, all the data points – gross and net equity, derivatives and debt data will need to be seen.
#3 Sector holding
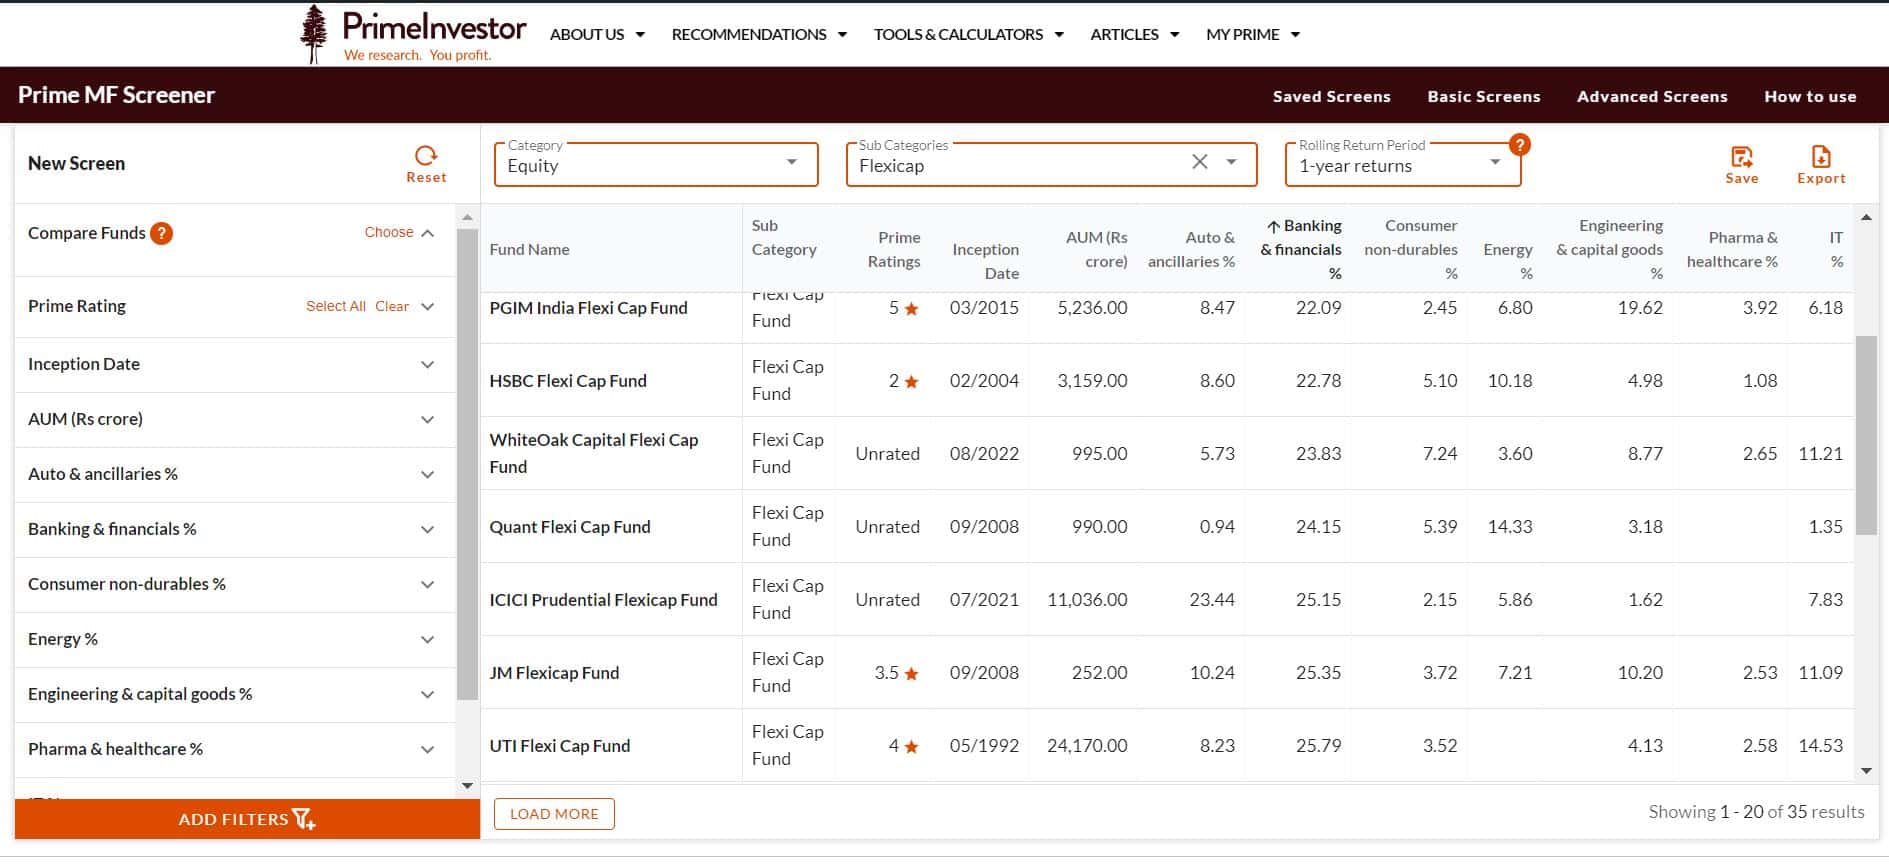
What we saw in the previous section was the holdings of funds in different market-cap segments or different risk instruments (for debt). In the Sector filter, you will see exposure by equity funds (yes, available only for equity funds) to key sectors. This is important in two ways:
- When you are specifically looking for funds with high exposure to specific sectors (note that such sector exposure can be changed by the fund manager at any time)
- when you want to know whether the funds you choose have some sector divergence between them.
Note that we have specifically restricted this to some key sectors that have weights in the index and would therefore be the more relevant ones to look for.
In the image below, funds are sorted in ascending order of banking & financial sector holdings to see if there are funds with lower exposure to banks. You might want to see which ones have higher exposure to the sector in flavour now – engineering & capital goods.
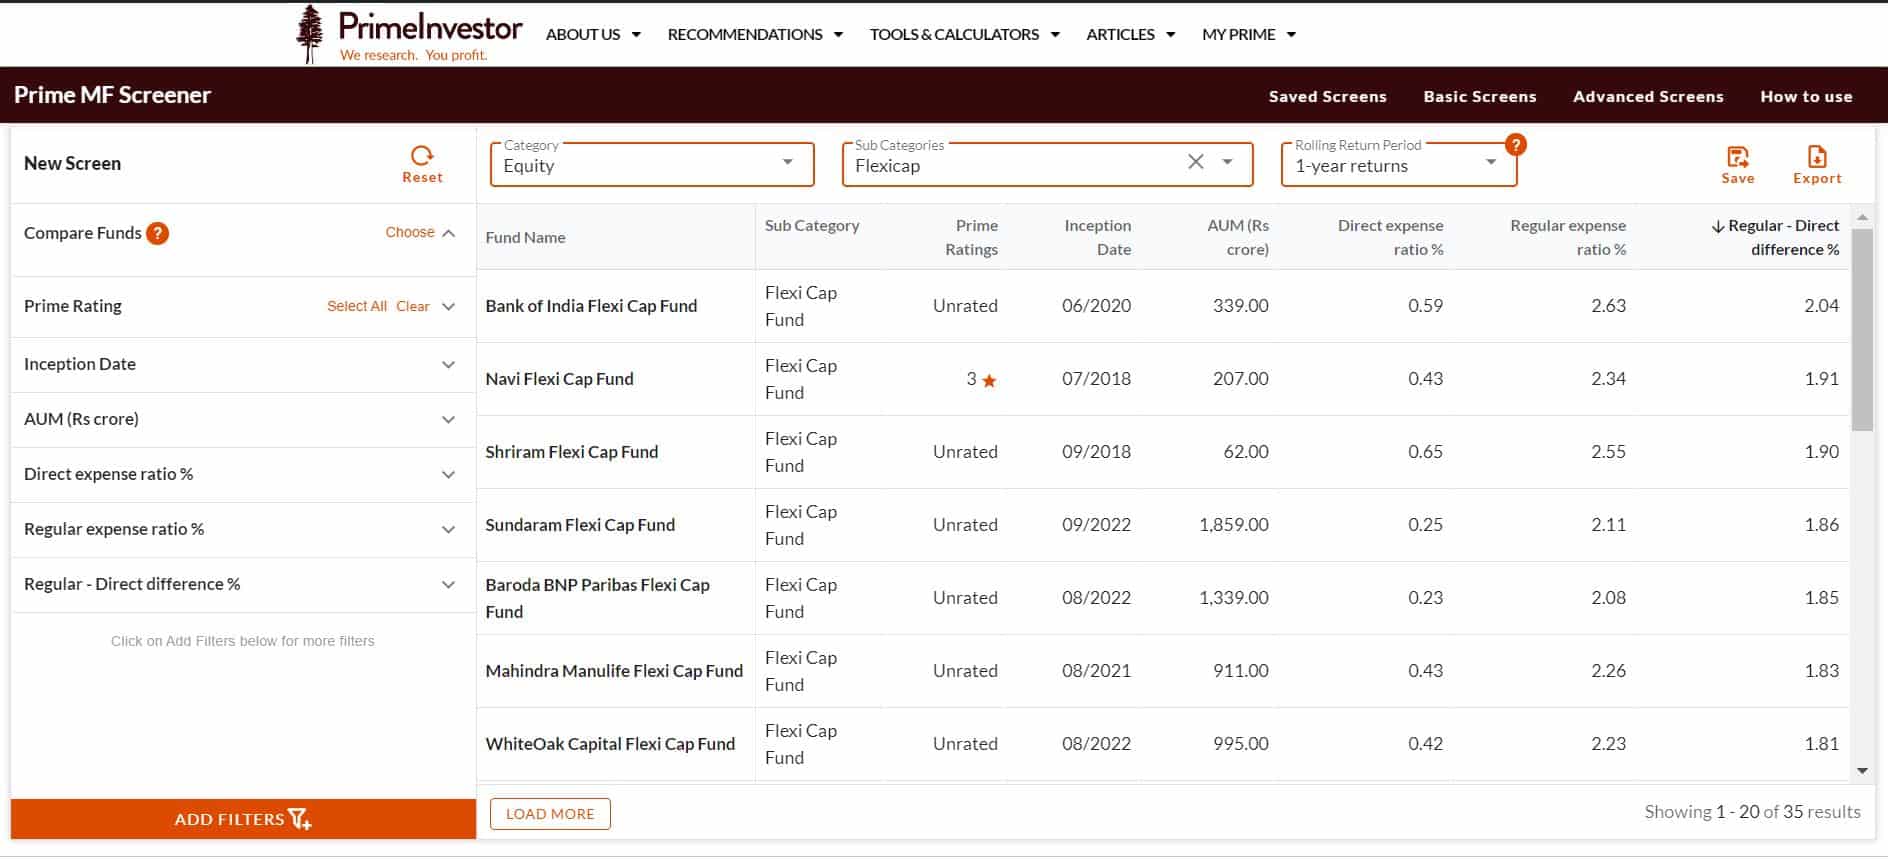
#4 Expense ratio
Expense ratio is a metric that you cannot ignore if you wish to know whether your fund is returning well for the money you pay. This becomes even more important if you are investing in regular plans.
For this, go to ‘Filters’ and check the direct and regular expense ratio as well as their differential. You can also check where your fund stands within the direct or even in the regular. You need to worry only if your fund’s expense is 10-15 basis points more than the category average.
In the below image, we have sorted the expense ratio differential in the order of highest difference first, in the Flexicap category.
The above five categories of analyzed data sets will help with the following:
- Do your own due diligence on funds
- Look up data on the funds you already hold and do a self-review.
- Create your own portfolio with funds that are distinct in their strategy and risk profile.
While I have shown all these as separate images, you can choose all the metrics in one shot and download them in excel to analyze.
Then there are other useful data points such as launch date and AUM that we show as default to ensure you are aware of the recency and size.
There are several other aspects of the MF Screener that are useful, but which we’re not going into detail here. But to give a quick mention - a very important feature that will help you filter/compare funds is the ‘Compare funds’ feature at the top-left which will let you create a list of funds for comparison.
For example, just searching for target maturity (unfortunately there is no SEBI category today and they are nested under corporate bond or gilt) will give you the entire list of target maturity funds. Then there are also pre-built screeners, for which we have explainers here.
So a lot of data about a fund that you may be looking for, or easy ways to compare funds can all be done with this single, super-useful MF Screener. Go ahead and check it out!
Funds given in the images are for illustrative purpose only and should not be construed as recommendations. Mutual funds are subject to market risks. Please read the scheme information and related documents before investing.


5 thoughts on “4 easy steps to picking good mutual fund schemes”
Hi Team PI,
Can you please explain your remark highlighted below under ‘Step 2 – Assessing return metrics’ tab….
Average rolling returns of category (necessary for hybrid funds and debt funds) -Within the top quartile compared with peers.
Are you trying to say that category returns should be in top quartile ..? What is the importance of the same?
Regards… Jatin
Sorry 🙂 what we meant was that the fund’s should be higher than category average and within the top quartile of peers. Will get that changed. Thanks for asking. Vidya
for midcap category additional comparison with midcap 150 index will also be useful
Our screener indeed takes that sir.
nicely explained.if tool can also provide SIP returns over1,2 ,3 ,5 yrs it will also be useful
Comments are closed.