In our previous post on the outlook for the Nifty 50 index, we had shared the view that the Nifty 50 index could get into a short-term correction. In that post, in addition to the Nifty 50 trends, we had also made a mention of three sector indices – the Nifty IT index, Nifty FMCG & Nifty Bank – that could be instrumental in triggering short-term corrections.

Well, both these scenarios played out. The Nifty 50 index did indeed correct, and the three sectoral indices mentioned above did play a big part in pulling down the Nifty. But the anticipated correction in the Nifty 50 index happened a little later and the then-mentioned bearish invalidation level of 18,000 was also breached.
So, it was the case of both a hit and a miss. The more pertinent question now would be: What next for the Nifty 50 index?
Long-term picture is intact
To address this question, let us again look at the price chart and the breadth chart to get some insights. As always, we shall consider the bigger time frame (valid for 9-12 months) charts upfront. Have a look at the 3% brick size Renko Chart of the Nifty 50 index featured below.
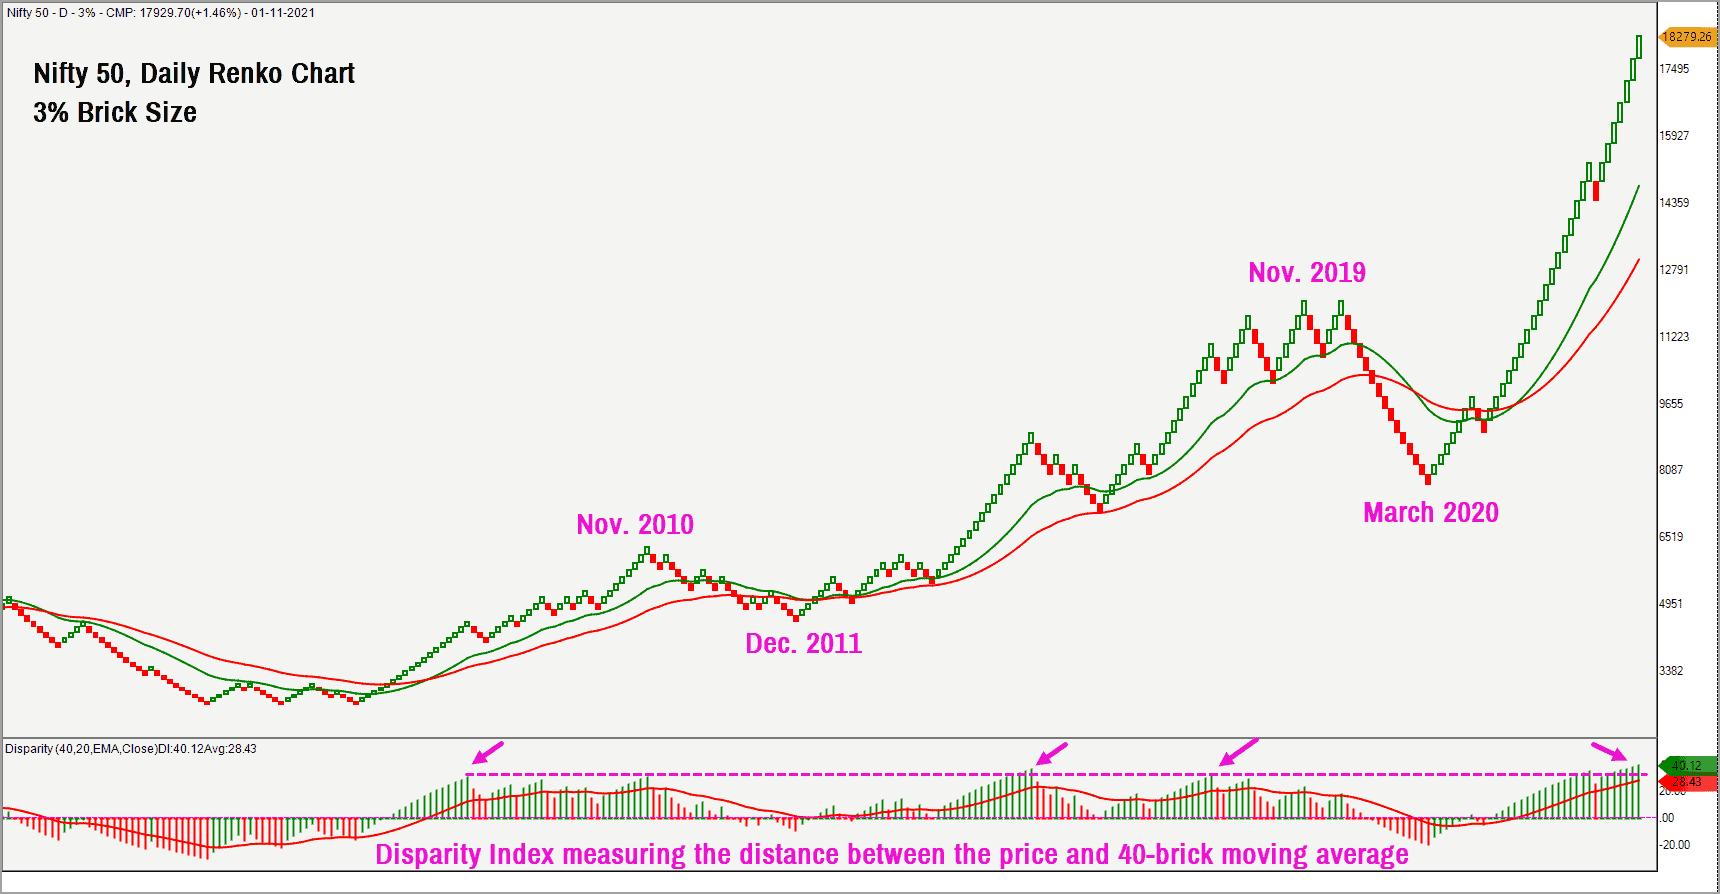
The Nifty 50 price has moved further away from its moving average compared to the previous post (see here). The Disparity Index indicator is plotted in the lower pane in the above chart. This indicator captures the distance between the 40-brick moving average and the price and expresses it in percentage terms.
The Disparity Index is at elevated levels suggesting an overbought scenario and this is still accommodative of a correction or consolidation in the Nifty 50 index. In fact, the price action in October 2021 has not invalidated the earlier case for a short-term correction. While the short-term correction did materialise, there remains a case for a continuation of this correction.

Short-term vs long-term breadth indicators
Let us look at a few breadth indicators to get a handle on how the Nifty 50 index is positioned in the short-term and long-term timeframes. The PF-X% breadth indicator captures the percentage of stocks that are in a bullish swing in the Point & Figure chart.
In the short-term timeframe (using 1% box size), the recent fall in the Nifty 50 index has pushed this PF-X% breadth indicator to an oversold region. This can result in a recovery in the index – and this was evident on Monday, with the Nifty 50 index gaining 1.5% to close at 17,929.65.
Now, consider a second short-term breadth indicator, which calculates the percentage of stocks trading above their short-term 20-day moving average from the Nifty 50 basket. This indicator has again turned around after hitting oversold level by the end of October 2021.
Therefore, the short-term breadth indicators of the Nifty 50 index have turned around after falling to an oversold region, as have quite a few sector indices as well. This confluence creates an ideal scenario for a sharp recovery, and it is this that appears to be playing out now.
But, as mentioned in our point above, the longer-term price charts still indicate that downsides are not completely off the table. The long-term breadth indicators also appear to support this. In contrast to the oversold short-term breadth indicators, the long-term breadth indicators are still overbought for the Nifty 50 index. The PF-X% indicator in the 5% box size in Point & Figure chart is still overbought at 78% while the percentage of stocks trading above their 200-day moving average is at an elevated or overbought level of 84%. This overbought condition in higher timeframes supports the case for further consolidation or correction in the Nifty 50 index.
The question, then, is whether the recovery will help the Nifty 50 index scale fresh highs above the recent high of 18,604 recorded on October 19, 2021 or will the correction continue. To answer this, therefore, either of the two scenarios below can play out:
- If the Nifty 50 index is unable to make any significant progress beyond the 18,604 peak, there will be a strong case for one more leg of downward correction. A fall below 17,300 would be a major sign of weakness and would strengthen the case for a deeper cut in the Nifty 50 index. A breach of 17,300 would not only result in a break of a prior swing low but would also complete a bearish sequence of lower highs and lower lows.
- If the Nifty 50 index moves past 18,900, it would imply that the undertone is still positive and the case for a deeper downside correction could be postponed.
For now, let us wait and watch how strong this recovery that started this Monday plays out.
To sum up
- The long-term price chart and the breadth indicator for the Nifty 50 index indicates overbought condition, favouring a cool off or correction
- In the short-term, the price and breadth indicators are at oversold regions favouring short-term recovery or bounce.
- If this recovery that commenced on Nov. 1, 2021, fails to push the Nifty 50 index to significantly beyond the recent high of 18,604, then it would be the first confirmatory sign of a deeper correction or fall in the Nifty 50.
- The second confirmation of a deeper fall would be the breach of 17,300 level.
- Stick to your regular SIPs and do not fiddle with it. Similarly, if you have a cash portfolio and if you have an exit plan, then just stick to it.
- Sector-wise, Realty, IT and Banks look promising from the short-term.
I am personally still cautious and looking for more clarity from the price action to confirm its preferred course of action. Further upside or downside targets would be shared when either 17,300 or 18,900 is crossed. Until then be cautious and be selective in stock picking.


2 thoughts on “Technical outlook: Nifty 50 – will the correction continue?”
IN summary you have mentioned ” if you have a cash portfolio and if you have an exit plan, then just stick to it.” Please elaborate
Hello:
I have been recommending in my posts to have a well documented exit plan for your direct equity holdings. It could be any plan that suits your objective. In my prior posts, I have also outlined a few basic exit options using technical analysis charts.
Else, talk to your financial advisor and chalk out an exit plan.
Hope this helps
Thanks
B.Krishnakumar
Comments are closed.