This is the next update in our series on the outlook for the Nifty 50 index. You can read the most recent update on the Nifty 50 here. In that update, it was mentioned that the outlook for Nifty 50 was positive, and the expectation was a rise to targets at 16,695 & 17,156.
These two targets of 16,695 & 17,156 have been achieved. Moreover, the next target at 18,630 is still valid. In this update, we revisit the price action and assess the current scenario and outlook.

Long-term scenario
As always, let us begin our analysis with the long-term chart. Below is the Renko Chart of the Nifty 50 index plotted using a 3% brick size. This chart captures the view that is relevant for 9-12 months.
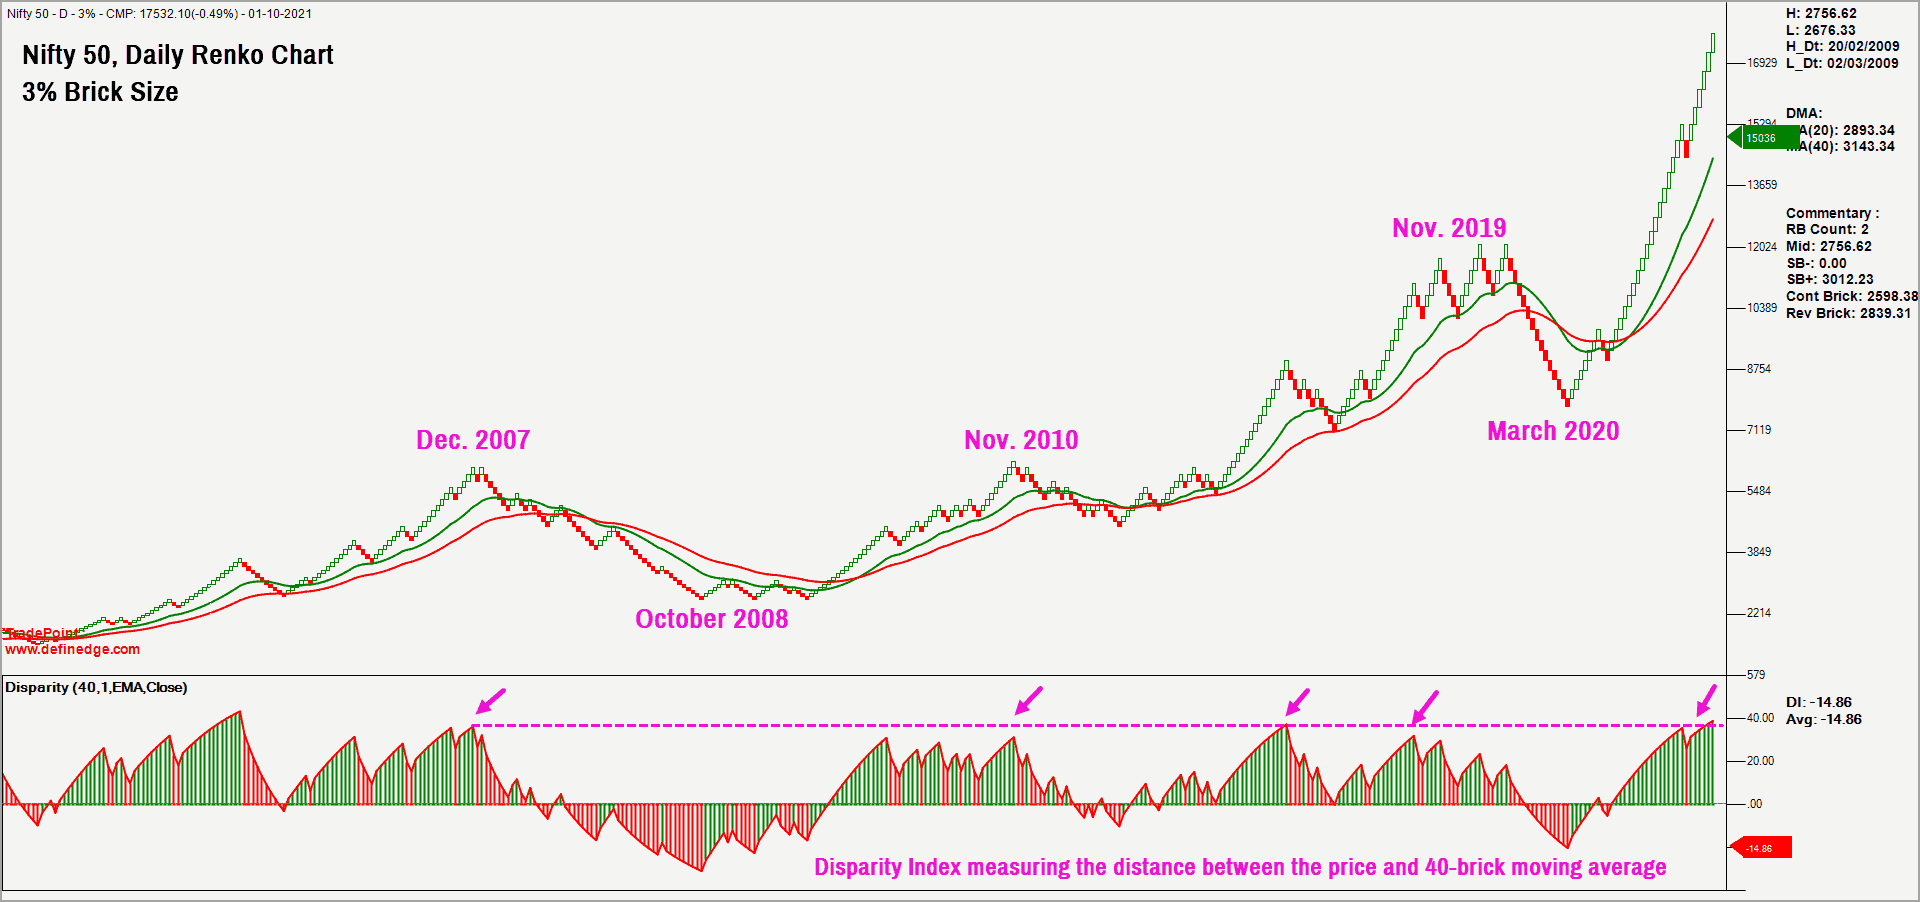
The Disparity Index indicator is plotted in the lower pane in the above chart. This indicator measures the distance between the price and the 40-brick moving average and expresses it in percentage format. It is apparent from the above chart that the Disparity Index is at elevated or overbought levels, from which the price has historically turned lower into a corrective phase. This is a cause of concern from a broader perspective.
The overbought scenario could be resolved in one of two ways:
- A range-bound action with a lot of volatility and sector rotation. This scenario played out during February – July 2021.
- A price correction wherein the Nifty 50 index can see a fall in price, resulting in a cool off in the Disparity Index.
However, at this point, which of these two scenarios will play out is anyone’s guess. Personally, I expect a fall in price, leading to a cool off in overbought condition. The short-term downside target based on the intraday charts works out to a 17,000-17,100 zone. We will discuss more other downside targets at a later date, based on how the price action unfolds.
For now, here’s explaining why I expect prices to correct.

#1 Shorter time-frame charts
The lower time frame chart is also supportive of a short-term correction or cool off in the price. Have a look at the Renko chart of Nifty 50 index plotted in 1% brick size.
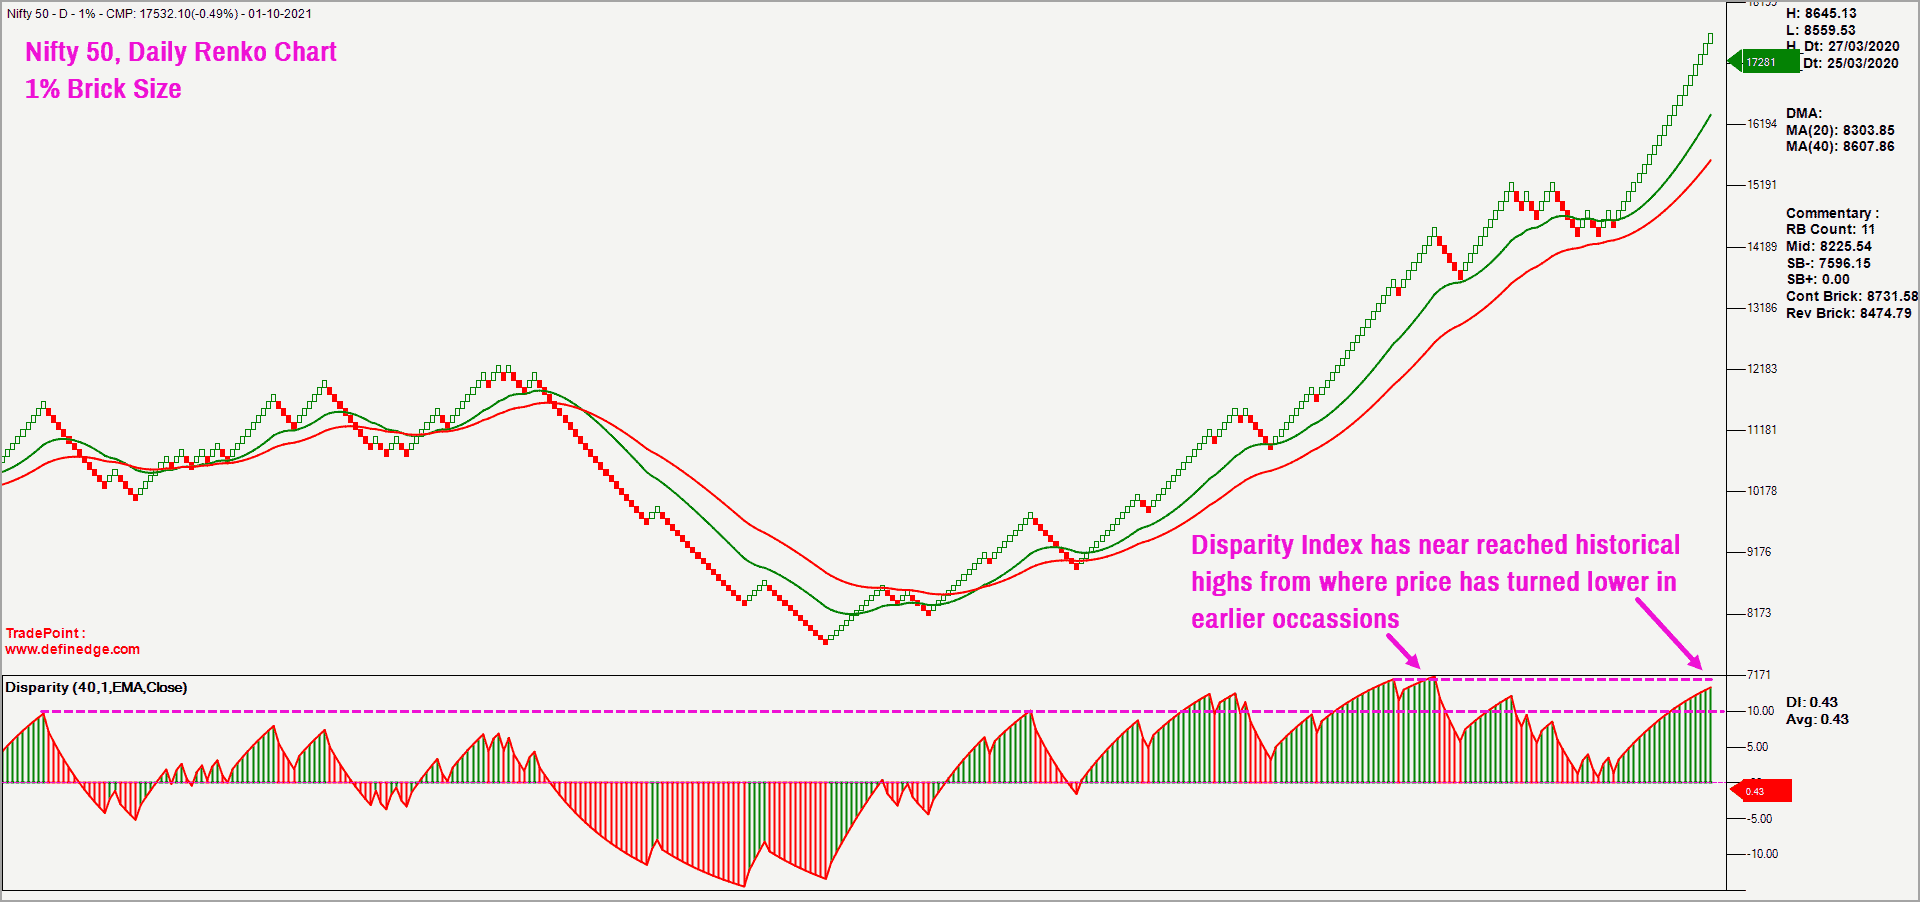
It should be apparent from the above chart that the price is some distance away from the moving average and the Disparity Index is at elevated levels. This again corroborates the possibility of either a short-term cool off or a range-bound, volatile price action.
Next, take a look at the daily Nifty 50 candlestick chart plotted along with the market breadth indicator. The percentage of stocks trading above their 50-day moving average is used as the breadth indicator. As highlighted in the chart above, there is a negative divergence between the price action and market breadth which is not a healthy sign. It indicates lack of participation of stocks from the Nifty 50 universe.
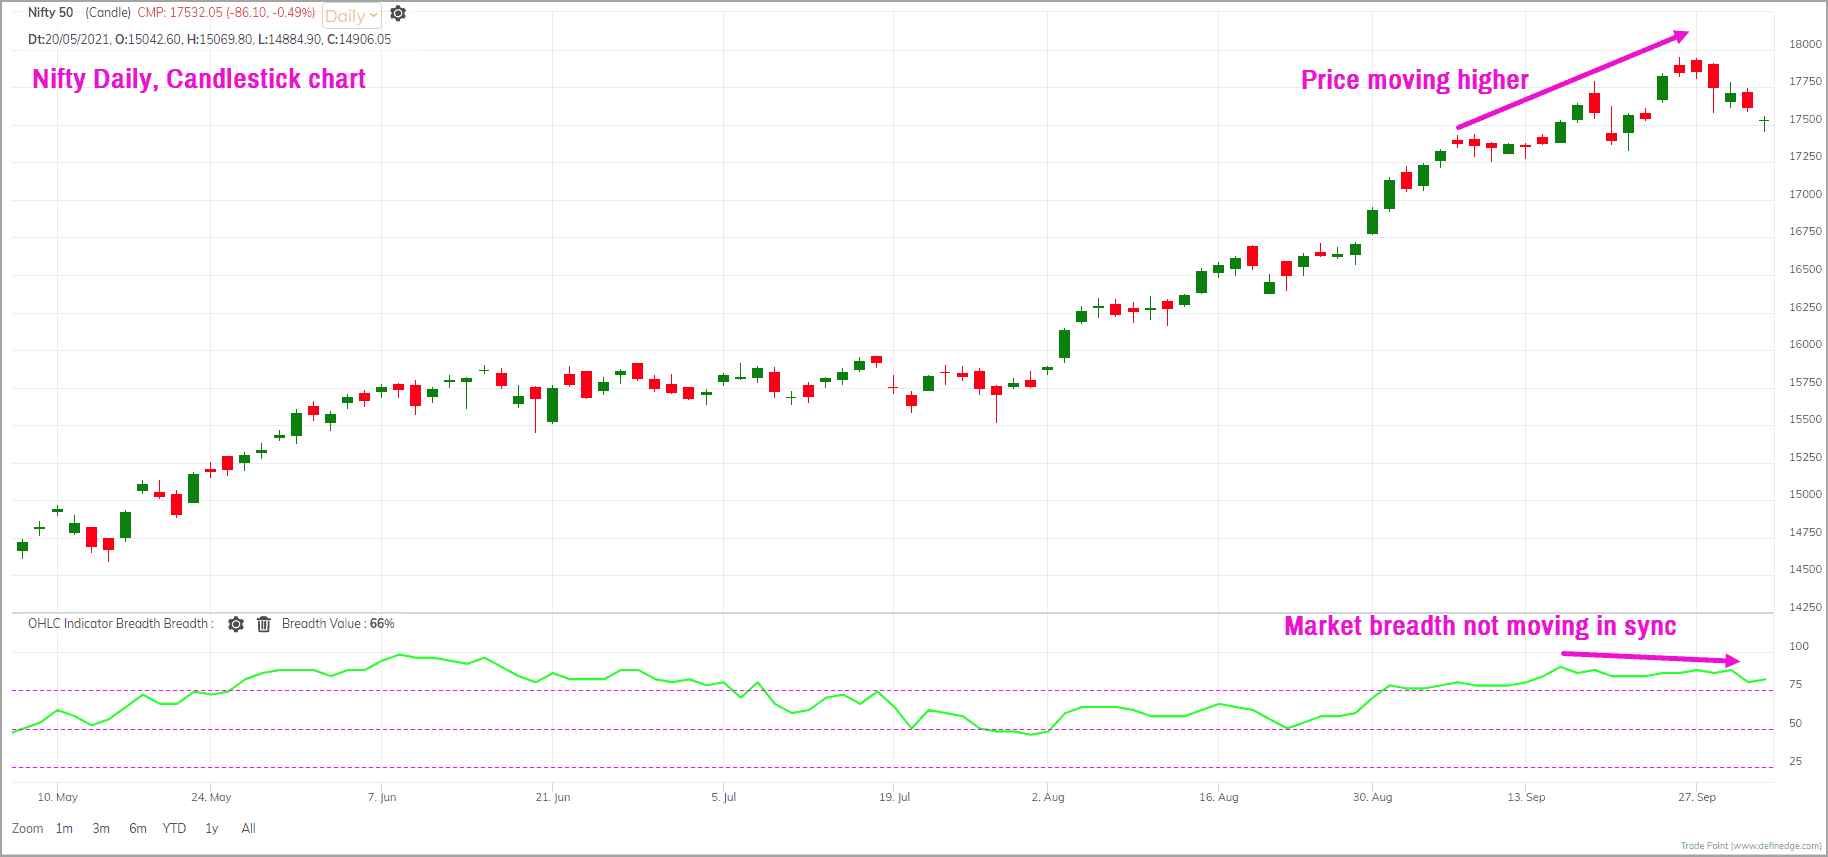
This divergence along with an overbought price environment are typical ingredients for a downside correction. Even the longer-term breadth indicator (percentage of stocks trading above their 200-day moving average) is overbought at 92% and has dropped from 94% last week, supporting the case for a cool off.
#2 Sector breadth
The other reason supporting the short-term cool off is the overbought breadth across the influential sectors such as Nifty IT, Nifty FMCG & Nifty Bank. These sectors have a big influence on Nifty 50 and considering the overbought condition, there is a possibility of a correction in these sectors. And, if these sectors were to correct, it would have a cascading impact on the Nifty 50 index as well.
Conclusion
Both the long-term and the short-term charts are suggesting that the price is at overbought levels, which could trigger a mean reversion or a correction. Based on the recent price action, the short-term target is 17,000-17,100. If the target is achieved, it would result in a breach of the recent swing low at 17,250. This would upset the bullish sequence of higher highs and higher lows. We will do a quick update with revised downside targets and possibilities when the price reaches the first target.
While there is a case for a short-term cool off there is nothing yet to suggest a bigger reversal or threat to the long-term uptrend. We will come up with an update as and when the scenario warrants.
For now, it is time to be cautious and tighten the risk parameters. Do not get too adventurous with fresh aggressive direct equity commitment. Please note that the view mentioned in this post is not relevant to your regular SIPs and other investments based on your long-term goals.

Here are the key takeaways:
- The short-term outlook for Nifty 50 is not positive. Expect a cool off to happen.
- The short-term target of 17,000-17,150 would be valid as long as the price stays below the 18,000-level.
- Your regular SIPs should not be altered based on the outlook expressed in this post.
- If you are among those actively trading or investing in the markets, then scale down your position size and tighten your risk parameters to protect your unrealised gains.
- As always, have a clearly defined exit plan for your investments, unless they are meant to be passed on to your next generation.
I deal with price action and technical analysis. Hence, I can share simple exit plans based on these studies. Please refer to the previous Nifty 50 update published in August 2021 for some ideas to decide your exits in your direct equity holdings.


4 thoughts on “Technical outlook: Can there be a correction in the Nifty 50?”
Dear BK
Although the charts shared by you clearly indicate what you have summarized in your key takeaways – and a lot of bears too are shouting from their rooftops that a correction is just around the corner. However – haven’t October-November generally been good months for both the US and Indian stock markets? For different reasons though, but both US and Indian investors like to ‘buy’ everything during these months (including stocks) rather than sell. In addition, the Macro data (GST collection, PMI etc.) seems good and improving – and result reason starting mid of October is also expected to be good.
How do we correlate technical charts with such seasonal sentiments and the fundamental data ? Do we look at it in isolation and plan accordingly – or we look at these things in correlation ? What if these 3 are contradictory?
Thanks
Hello:
There is always going to be dichotomy between the fundamentals & price action. And, remember, stock market tends to discount the future. Your question about seasonality is well taken. I am not calling for a big crash or a reversal. Am just looking for a cool off which could be in terms of price or time (similar to the Feb-July 2021 period).
And, seasonality is not 100%. There are exceptions. How can we forget the October 2008 crash. I have tried to articulate my thoughts based on the current evidence available. If I am wrong, we can make a course correction.
And, as I always say, have a plan and execute it. This way, you will not be worried about contradiction among multiple factors. Try to factor in all aspects while deciding a plan of action and then focus on just implementing the plan.
In stock markets, a process based approach is essential for make money consistently. We are not in it for the next trade or next investment. We must look at things over next several trades or several years.
Regards
B.Krishnakumar
Thank you for the article.
Query:
Should long term investor(7-10 years of time horizon) worry about short-term correction?
My specific sutiuation, a month back I received chunk of money. I am confused that should I invest lumsum amount in the market now as everybody expects some sort of correction so wait for it. Are instead of opt for SIP for next one year? Currently I parked the money in liquid funds and waiting for the opportunity to invest in lumpsum.
Note: I will be picking funds from prime funds recommendation as it is already giving me good returns. Thanks for your teams detailed analysis.
Hello:
Please consult your financial advisor regarding specific requirements and suggestions.
Regards
B.Krishnakumar
Comments are closed.