Along with global markets, Indian markets too have been under pressure over the past few weeks. But then, the Indian markets have displayed remarkable resilience compared to the US counterpart.
In the previous update on the Nifty 50 outlook, we had flagged concerns about the overbought breadth in the higher time frame and that the breach of 17,300 would trigger a deeper correction with heightened volatility. This scenario is currently unfolding in the Nifty 50 index.
The questions at hand now are – one, what the short-term outlook is and two, whether the Nifty 50 index could retest or even breach its June lows. We shall address the first question in this post and discuss the second question in a subsequent post.
Short-term Nifty 50 outlook
The recent fall in the Nifty 50 index resulted in the much-need cool off in the breadth indicator across time frames. As always, we will use the PF-X% breadth indicator to study the short and medium-term breadth. This indicator captures the percentage of stocks that are in a bullish swing in the Point & Figure chart.
To study the short-term breadth indicator, we use the 1% box size chart. The PF-X% in the short-term time frame has recovered from an oversold level of 12% and is currently positioned at 28%. In the next higher time frame, the PF-X% in the 3% box size has cooled off from the overbought zone and is currently at 46%. And in the next larger time frame of the 5% box size, the breadth indicator again has cooled off from the overbought zone and is at 72%.
Hence, breadthwise, there is no major threat of price fall in the short-term as the PF-X% based on 1% and 3% box sizes are comfortably placed. The 5% box size is still a cause of concern as it has just marginally cooled off from the overbought zone.
Now, let us move to the price action to get more clarity about the short-term outlook. Here is the daily Renko chart of the Nifty 50 index plotted using 1% brick size.
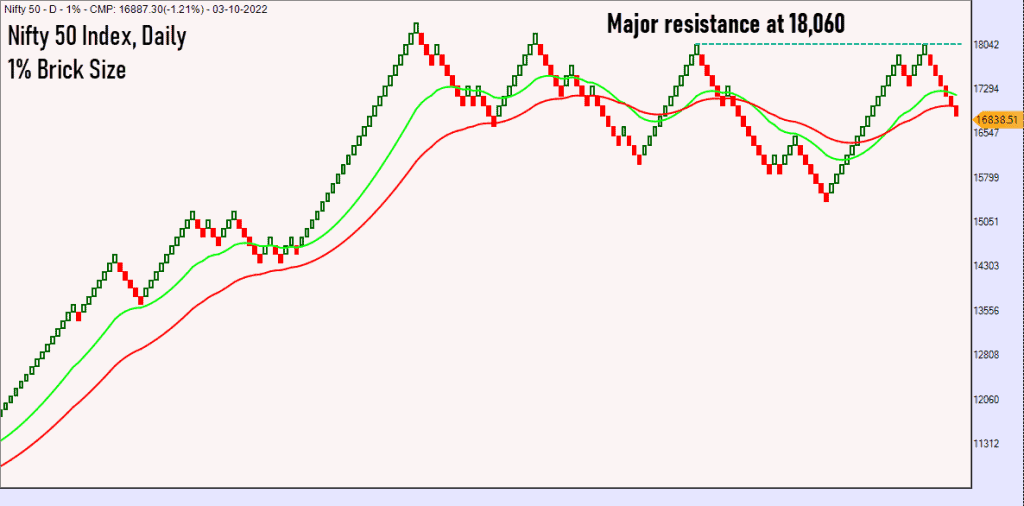
The price is currently perched below the moving averages which is a bearish sign. However, the moving averages are positively aligned with the 20-brick exponential moving average, positioned above the 40-brick exponential moving average. So, there is a bit of a dichotomy at play here. We will have to wait and watch which of the two scenarios mentioned below will play out:
- Scenario 1: Price stabilising here and moving up, resulting in a close above the two moving averages.
- Scenario 2: Price falling further, resulting in a negative crossover of the moving averages, whereby the short-term 20-brick exponential moving average will fall below the 40-brick exponential moving average.
Obviously, the first scenario is a bullish outcome and the second is bearish.
As observed in the previous post, the 16,400 level assumes significance as it is the swing low and the origin of the strong bullish momentum witnessed during the post-June rally. If this level is breached, there would be a strong case for the bearish case scenario to play out. This could open the possibility of a slide to 15,900.
On the other hand, a move above 17,500 would be a sign of strength and could indicate that the correction is over, and price could head towards challenging the all-time highs. Therefore, for now, 16,400 & 17,500 are the levels to focus on.
Personally, I still believe that the recent fall is just a correction, and the June lows are unlikely to be breached. But this view will warrant a reconsideration based on how the price action unfolds over the upcoming weeks.
Quick look at sectors
Sector-wise, the Nifty Bank index has been underperforming the Nifty 50 index over the past few weeks. Remember, this index was a strong outperformer during the Nifty 50 rally off the June 16 lows. The Nifty Bank index must move above 39,500 to indicate the scope for further upside move.
Similar to the Nifty Bank index, the Nifty Auto sector too has corrected recently and has been a short-term underperformer against the Nifty 50. A move past 12,750 would be a sign of strength and could signal the resumption of the prior outperformance cycle in the Auto Index.
Another key sector is IT. The Nifty IT index has been in a downtrend since the beginning of January 2022 and has been a heavy underperformer versus Nifty 50 index. But in the past few weeks, the index is consolidating in a tight range. A close below 25,900 would indicate the resumption of the recent downtrend. A move past 27,800 would be a positive sign for the Nifty IT index.
A final sector that bears mention is the Nifty Pharma index. While this index has been a terrible underperformer, it has shown a lot of promise during the recent fall. The index has been an outperformer during the recent fall witnessed in the Nifty 50 index. Though it is too premature to get excited or look at the Nifty Pharma index from an investment perspective, it would be worthwhile to track this sector. Any sustained rise in the index along with outperformance versus Nifty 50 index would be more interesting. For now, keep this sector in your watchlist for potential opportunities later. As always, we shall keep you posted with regular updates.


1 thought on “Technical outlook for the Nifty 50”
Useful analysis. So, can we still continue to SIP in a Nifty 50 index fund for long term (5+ years)?
Comments are closed.