The price action in the Nifty 50 index, and the broader markets in particular, have been extremely bullish. The overbought scenario in the short-term breadth indicator was resolved by a sideways consolidation in price. This is a major sign of strength indicating that prices could power higher. In a downtrend or a weak market environment, the overbought breadth would typically lead to a sharp price correction, which will in turn lead to a cool off in the breadth indicator.
When the price gets into a time correction and consolidation rather than a price correction, it is a sign of a strong bullish undercurrent. Interestingly, the breadth indicator of the broader market has improved steadily and the Nifty MidSmallCap 400 index has displayed relative strength and outperformance versus Nifty 50. This, again, is a positive sign suggesting that the buying interest has percolated to the broader markets.
The other important observation is the relative outperformance of the high-beta Nifty Bank index. This index was underperforming the benchmark Nifty 50 index for a while. However, since the June lows, there is a clear outperformance of Nifty Bank index versus Nifty 50, which is a healthy sign.
Where is the Nifty 50 headed?
I am sure that this is the question lingering in everyone’s mind! Let us address it with the set of tools that we are familiar with. Here is the Nifty 50 daily chart, plotted in Point & Figure format.
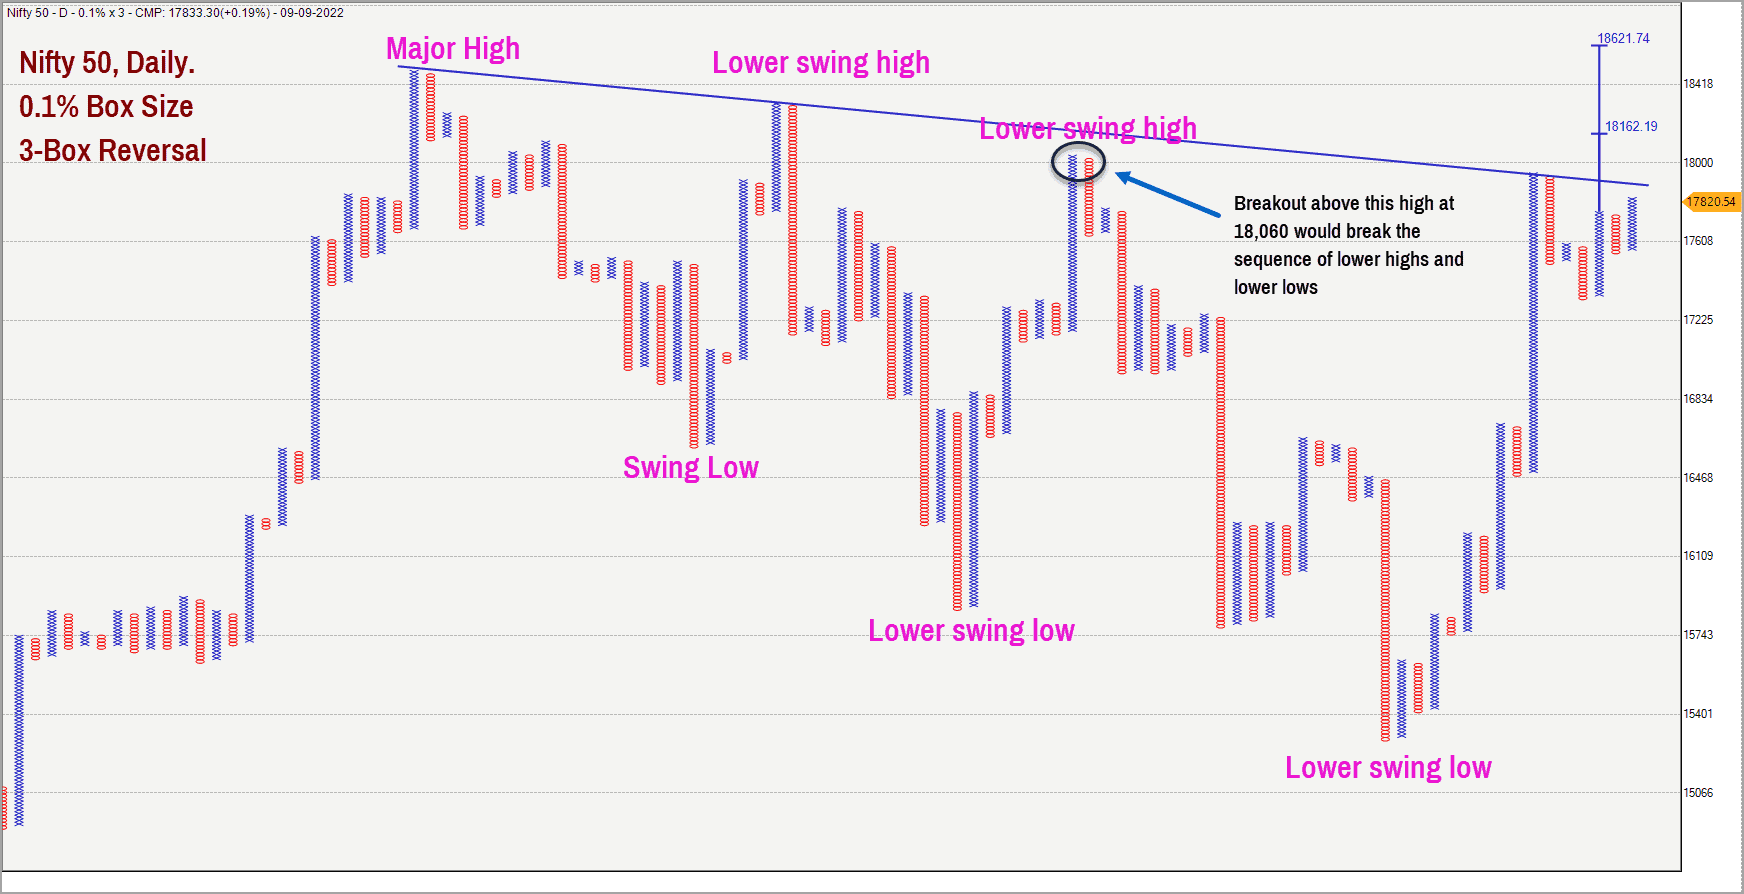
As highlighted in the chart above, a close above 18,060 would break the bearish sequence of lower highs and lower lows. More importantly, this breakout will also complete a bullish sequence of higher high and higher low. And this breakout past 18,060 will also push the index above the key downsloping trendline drawn in the above chart.
The vertical count target is also plotted in the above chart. The short-term target is 18,162 and the major target is 18,621. These targets would be valid as long as the price holds above the recent swing low at 17,300.

However, note that a breach of 17,300 will not necessarily have bearish connotation. It would just be a pointer to the possibility of a much deeper downside correction before the journey to new high begins. Only a close below 16,400 would warrant a serious reconsideration of the bullish outlook for the Nifty 50 index.
I wish to wind up my thoughts on Nifty 50 with a note of caution regarding the breadth indicator in the higher time frame. As highlighted in the previous post on what to expect from the Nifty 50, the breadth indicators are still at the overbought zone in the higher time frames. But historically, there have been instances where the Nifty 50 index has managed to head higher despite overbought breadth prevailing in bigger time frames. I expect a similar scenario to play out.
If the 17,300 mark is breached, it could be a sign that the cool off of the breadth in a higher time frame is playing out. This could lead to bouts of volatility and deeper correction. But I expect the broad trend to be on the way up for the Nifty 50 index. We shall revisit the bullish case hypothesis if the 16,400 level is breached.
Outperforming Sectors
There are quite a few sectors that are displaying relative strength and outperformance versus Nifty 50. The most prominent and consistent among them is the Capital Goods sector. Here is the relative strength chart of the BSE Capital Goods Index versus Nifty 50, plotted in the Point & Figure charting format.
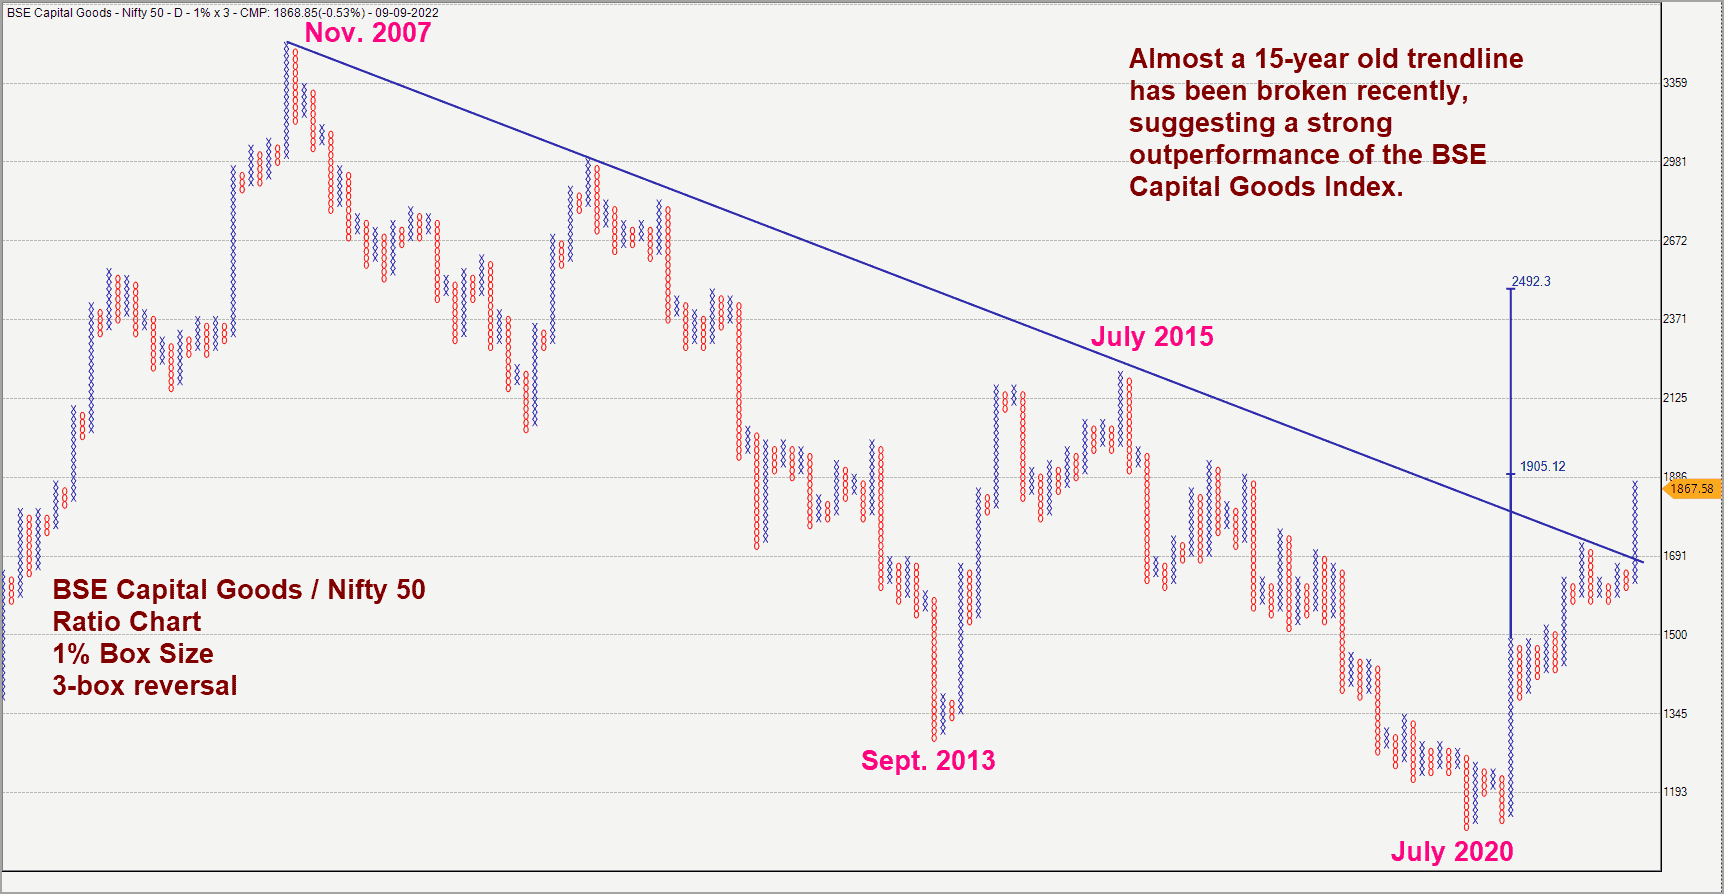
As highlighted in the above chart, there is a clean breakout of a 15-year-old trendline in the relative strength chart, suggesting strong outperformance of the BSE Capital Goods Index. Most of the stocks from the sector are trading at or near their all-time highs which is a big positive sign.
There is also a vertical count target in the above relative strength chart which indicates the scope for the recent outperformance to sustain. Keep an eye on the stocks from this sector and include the fundamentally sound ones from them in your portfolio. You can use Prime Stock Screener to filter stocks from this space. Otherwise, Prime Stocks features a few stocks that stand to gain from the capital goods sector, while Prime Funds has a thematic fund that plays the overall manufacturing recovery.
The banking sector is another interesting sector showing a lot of promise. Within the banking space, the PSU Bank index is showing a lot of strength recently. This sector was a terrible underperformer versus Nifty 50 for several years. Recently, there are growing signs of strength in the sector and this strength has translated into relative outperformance in relation to the Nifty 50 index. A break below 2,700 in the Nifty PSU Bank Index would be a red flag and would warrant trimming of exposures in the sector. As long as the PSU Bank index sustains above this level, there is a case for a rise to the 3,360-3,400 range.

You can shortlist the fundamentally sound stocks from the bank space for inclusion in your portfolio. Else, taking exposure via the ETF (a recent recommendation on bank ETFs is here) or mutual fund route is also an option to consider. You can also consider PrimeInvestor’s financial-themed smallcase Financial Disruptors.
The Nifty Auto Index and Nifty FMCG index continue to display strength. As highlighted in last month’s post, the broader markets are still displaying a lot of strength. Funds with exposure to mid and small cap stocks may therefore be good portfolio additions if you wish to play the space.


2 thoughts on “Nifty 50: More bullishness ahead?”
Yet another time, where I was expecting a downtrend (based on prior read of yours) and I got it wrong
Hello:
I always share my views and analysis based on the facts / data points available. If you note carefully, my downside targets in the previous articles were not too far away from the then prevailing levels. This is the first pointer that I was not excessively bearish. The second important factor to note is that the downside trigger level mentioned in the post was not triggered and the upside levels were crossed. This in essence suggested that there was no merit in remaining bearish.
I hope I do not get this woefully wrong this time around!
B.Krishnakumar
Comments are closed.