![]() We have been voicing our concerns regarding how overbought the Nifty 50 index has been in the bigger time frame. And, we have been expecting a cool off or correction in the index for the last three months. The view shared in this post on the Nifty 50 outlook is playing out and the Nifty 50 index is reverting to its mean.
We have been voicing our concerns regarding how overbought the Nifty 50 index has been in the bigger time frame. And, we have been expecting a cool off or correction in the index for the last three months. The view shared in this post on the Nifty 50 outlook is playing out and the Nifty 50 index is reverting to its mean.

The key questions now would be – first, is the correction over, and second, what is in store now. Let us address both these questions with the charts (which you must be familiar by now!). Let begin our study with short-term charts.
Is the correction over?
To assess the short-term outlook, we shall use the 1% brick size Renko chart. This chart is displayed below.
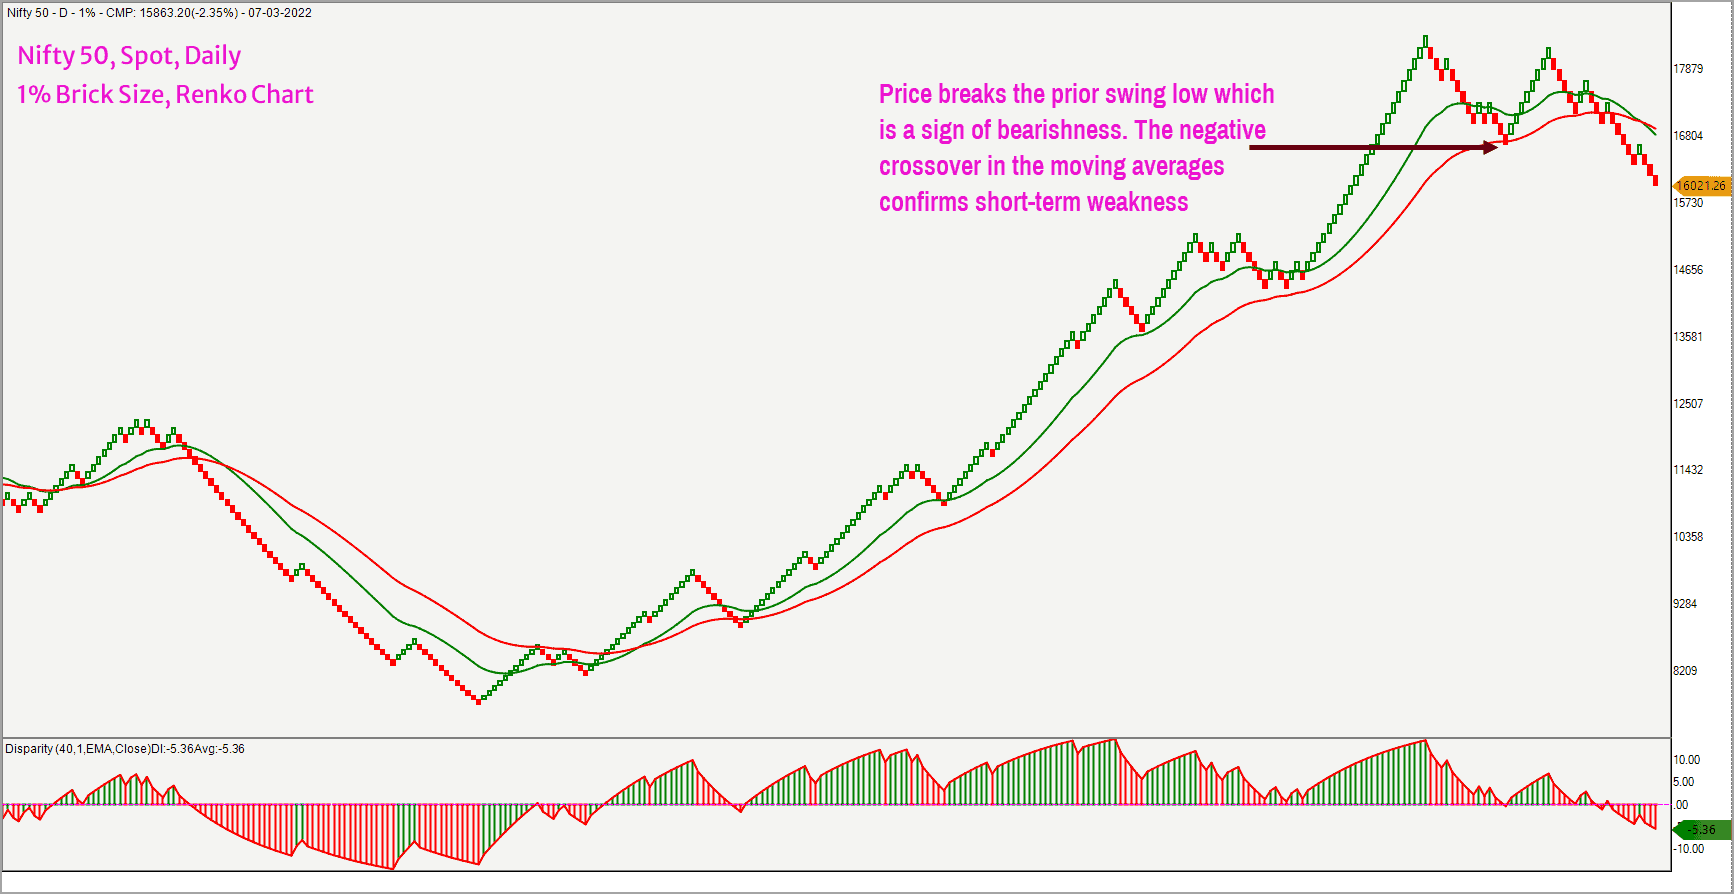
As highlighted in the above chart, the price has broken the prior swing low and is tracing out a bearish sequence of lower highs and lower lows. The short-term moving average has crossed below the long-term moving average and the price is trading well below these averages, confirming the bearish undertone.
Going by the above chart, therefore, is clearly suggestive of underlying weakness in the Nifty 50 outlook. The vertical count target for the Nifty 50 index in the 0.1% Point & Figure chart works out to 15,065. The target based on the horizontal count method works out to 15,500 which is the upper end of the target range. The lower end of the target zone works out to 14,600. Broadly speaking, I would not be surprised to see the Nifty drifting lower to the 14,500-15,100 zone.
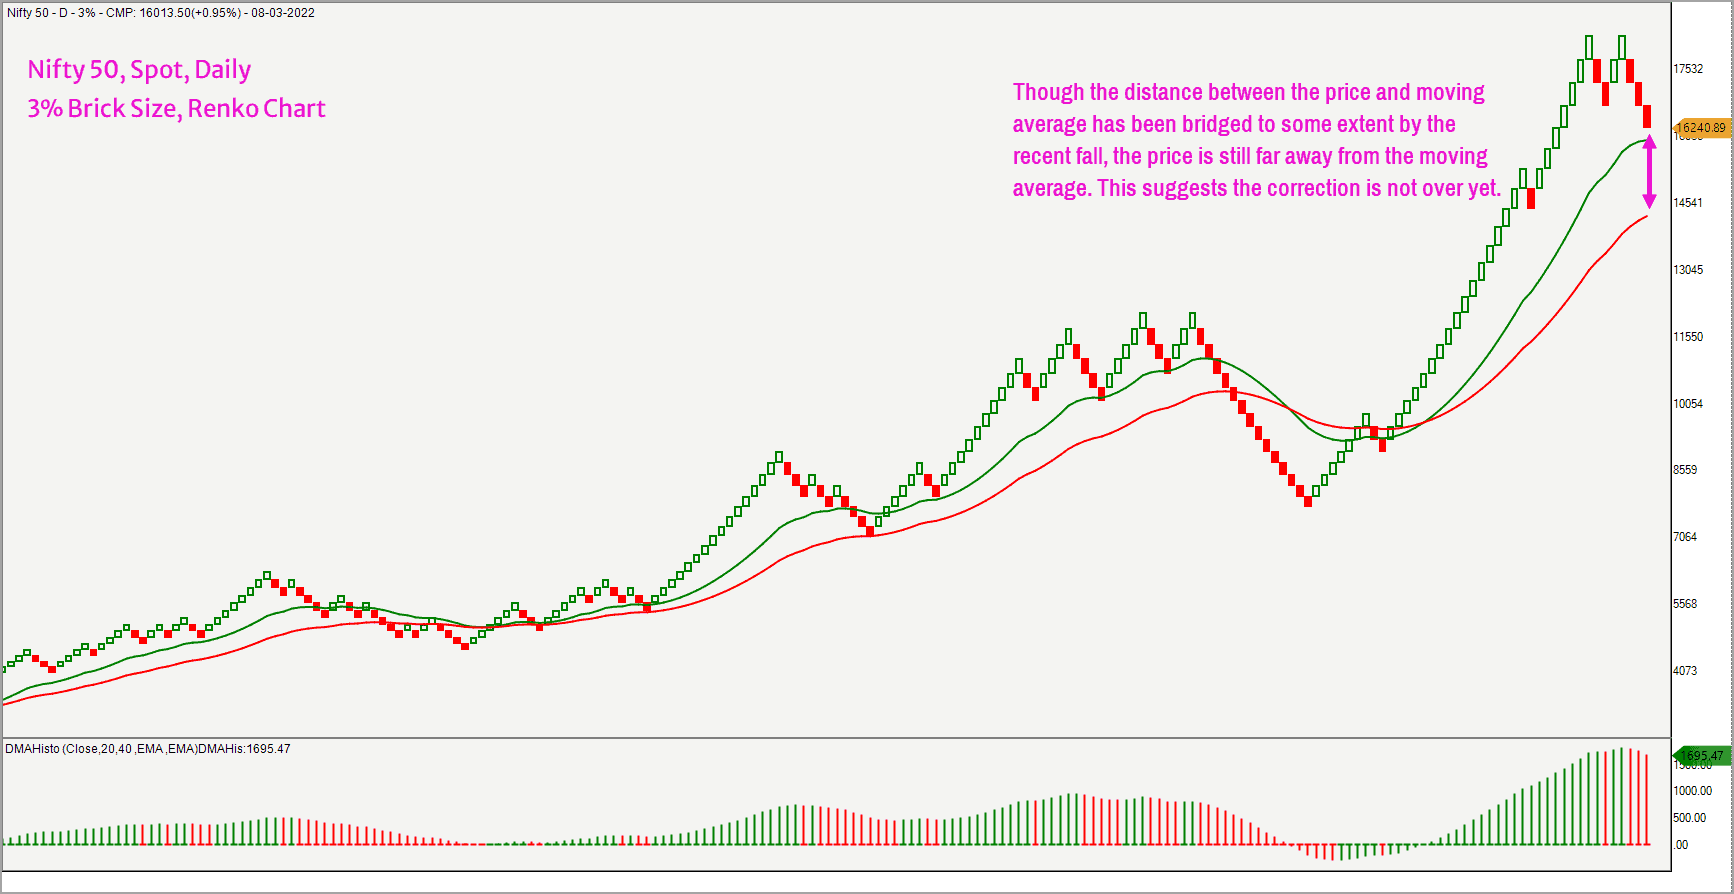
So, I still feel that the correction is not over yet. Before studying the short-term outlook, it is important to highlight that the Nifty 50 index is still some distance away from its moving average in the 3% Renko Chart. This means the overbought condition in the bigger time frame is not fully addressed yet.
Here is the chart for your reference.
Short-term view
To study the short-term outlook, let us take a look at the market breadth and the short-term Nifty 50 Renko chart plotted using the 0.5% brick size.

We shall begin with the breadth indicator. On this front, let us look at both the short-term and the long-term indicators. The short-term breadth indicator of choice is the percentage of stocks trading above their 50-day moving average. For the Nifty 500 universe, this ratio is currently at 11% which indicates oversold conditions. This suggests that just 11% of the stocks from the Nifty 500 universe are trading above their short-term 50-day moving average.
Just to put things in perspective, this indicator was at an overbought level of 80% in October 2021 when the Nifty 500 index peaked just above the 16,000-mark. The short-term breadth indicator is oversold and suggests that the scope for further damage might be limited at least in the short-term.
Let us also look at another breadth indicator calculated using the Point & Figure charts. The indicator of choice here is the PF-X% indicator. This indicator captures the percentage of stocks that are in a bullish swing in the Point & Figure chart. We shall calculate this indicator in the 3% box size.
This indicator too is at an oversold level of 22% and has recovered from the low of 8% recorded on February 24, 2022. The recovery in the breadth indicator is a sign that there is some improvement and buying interest in the broader universe.
Let us take a look at the smaller time frame price action using the 0.5% brick size Nifty 50 Renko chart to understand the context.
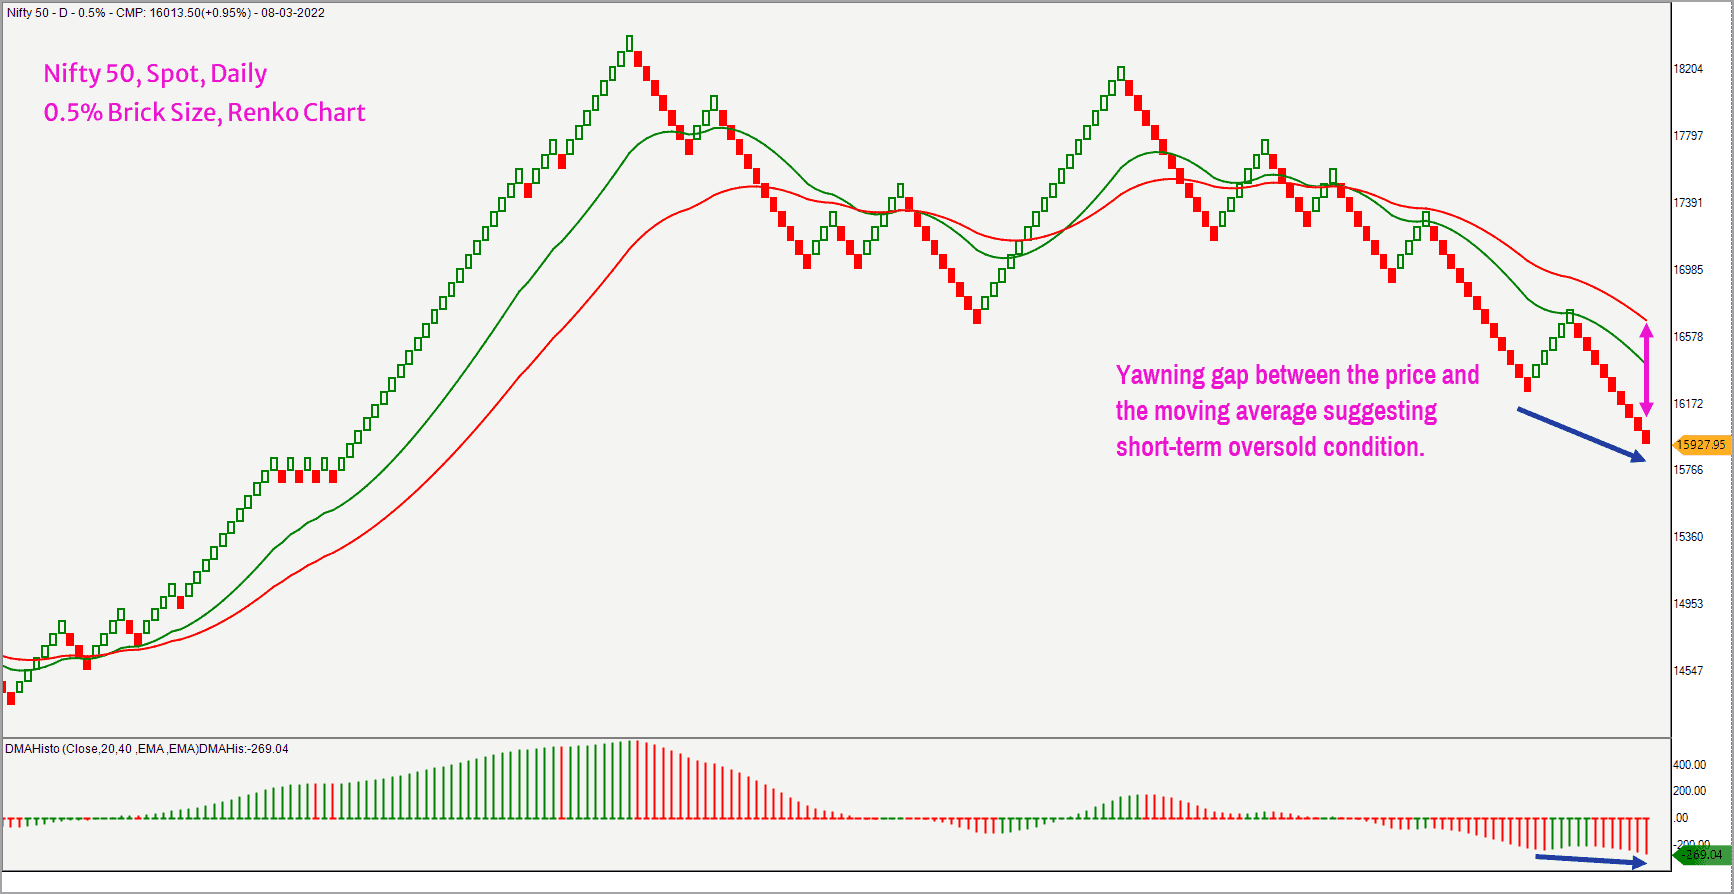
The DMA histogram indicator is plotted in the lower pane in the above chart. This indicator measures the difference between the short-term and long-term moving average and is a reliable tool to measure momentum.
If you notice, both the price and the indicator are making lower lows, suggesting there is no divergence yet. Typically, major tops or bottoms are formed after a divergence between the price and the momentum. Though the occurrence of divergence is not mandatory, it is always preferable and happens more often than not.
The other interesting aspect to note is the widening gap between the moving average and the price in the above chart. This suggests that the recent fall has pushed the price far away from the moving average, indicating short-term oversold condition.
So, the market breadth and the short-term price charts are suggesting oversold conditions, favouring a short-term bounce. But the long-term chart suggests that the correction has not run its entire course yet.
If you are someone who is nimble-footed and adept at short-term trading then there is a case to look for long trades, with appropriate stop loss or risk management measures. The short-term target is 16,300-16,500 for the Nifty 50 index and the major resistance is at 16,800-16,850 zone. The short-term rally can extend up to this resistance zone.

We shall review our long-term outlook if the Nifty 50 index closes above the 17,000 level. Until then, I would be in the camp looking for a drop in the Nifty 50 to at least 15,500 or lower.


7 thoughts on “Short term outlook for Nifty 50”
Eagerly waiting for the review!
i refer to your article dt 08/03/2022 “Short Term Outlook for Nifty 50” by B KRISHNAKUMAR. Pl inform whether you hold the said views in view of the present rise in the stock indices. Short Term is generally understood to be for a period ranging from 3 months to less than a year. Today NIFTY 50 is above 18000. pl issue an update on the above views.
Hello:
We will share the updated view very soon.
Regards
B.Krishnakumar
Thanks for the revert. Will be waiting eagerly.
now that NIFTY has crossed 17000 on closing basis, please revisit and share revised long-term outlook.
thank you!
Thank you. Very informative and useful article
Timely and (as always) useful article.
Comments are closed.