![]() In our previous post on the outlook for the Nifty 50 index, we had shared the view that the correction in the Nifty 50 was incomplete, and we were making a case for a bounce to a lower high and one more push lower. This scenario played out in November and the Nifty 50 index hit a low of 16,782 on November 29, 2021, before registering a recovery.
In our previous post on the outlook for the Nifty 50 index, we had shared the view that the correction in the Nifty 50 was incomplete, and we were making a case for a bounce to a lower high and one more push lower. This scenario played out in November and the Nifty 50 index hit a low of 16,782 on November 29, 2021, before registering a recovery.
The key question now is this – is the correction complete or not? As always, we will address this question by looking at the price chart and the market breadth data to arrive at a holistic picture.
Long-term picture is overbought
To begin with, we shall consider the bigger time frame (valid for 9-12 months) charts. Have a look at the 3% brick size Renko Chart of the Nifty 50 index featured below.
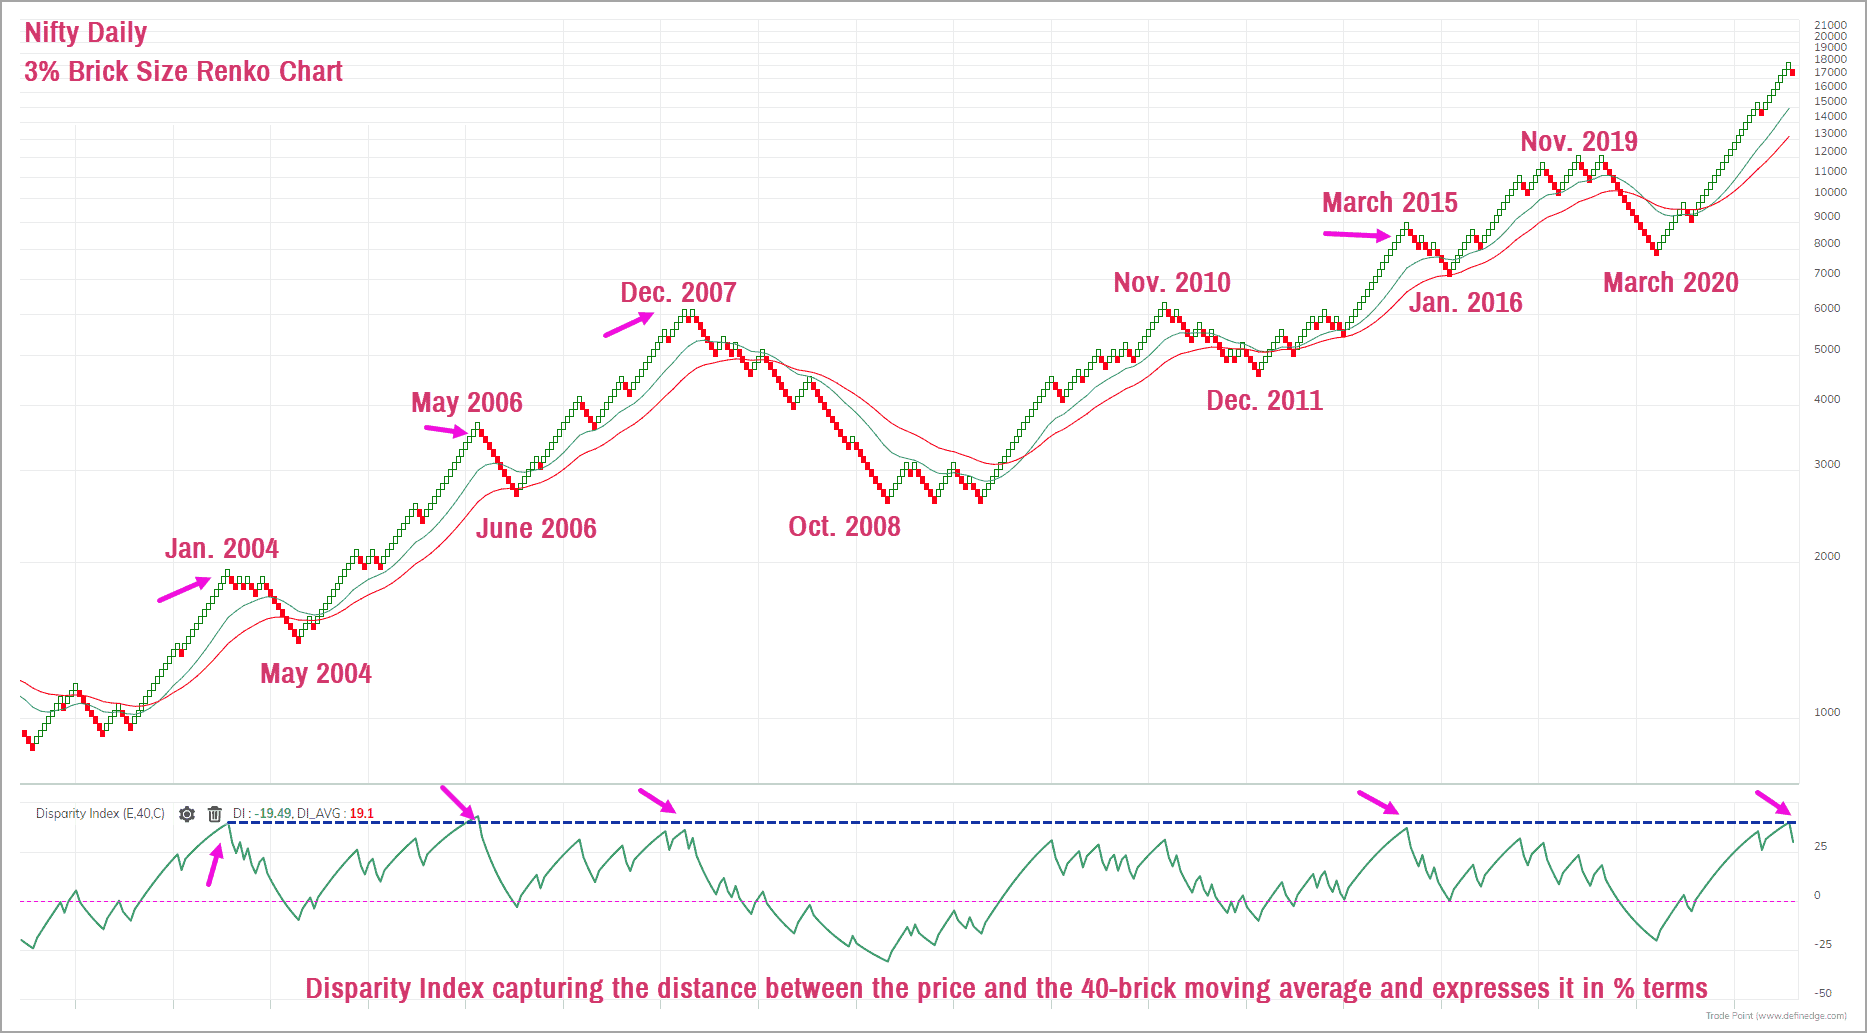
In the previous two updates on the Nifty 50, we have been voicing our concern about the overbought scenario prevalent in the Nifty 50 index in the longer time frame. In the above chart, the Disparity Index, plotted in the lower pane, is still at elevated levels. This indicates that the overbought condition continues to be prevalent.
This time, the Disparity Index is currently at levels from which price has tended to revert to the moving average on several occasions earlier. A similar scenario can play out this time too. The recent such mean reversion happened in early 2020, triggered by the Covid-19 virus outbreak.
But notice how the Disparity Index was displaying overbought condition for several months prior to the eventual correction in March 2020. Hence, remember that it can take a few months before a scenario of mean reversion plays out. Another important point to highlight is that this mean reversion can happen in either of the two scenarios detailed below.
- The gap between the price and the moving average can be bridged by a sharp fall in price. This would be brutal and could remind us of a March 2020 kind of scenario.
- The other possibility is that the mean reversion can happen through a prolonged sideways move in price. Take a look at the price action in the Nifty 50 index during February – May 2021 for reference. A more prolonged version of this price action can play out in order to help the Disparity Index cool off from elevated levels in the 3% brick size.
The question, then, would be which of these two scenarios is likely to play out. The answer is your guess is as good as mine! At this juncture, there is nothing to suggest or favour one scenario over the other. This is where your exit rule or strategy would come in handy.
Short-term outlook & breadth indicators
If that’s laying out the longer-term scenario, the shorter time frame is where things are more interesting. Here is the daily Nifty 50 chart plotted in the Renko charting format, using 1% brick size. This represents short-term price action.
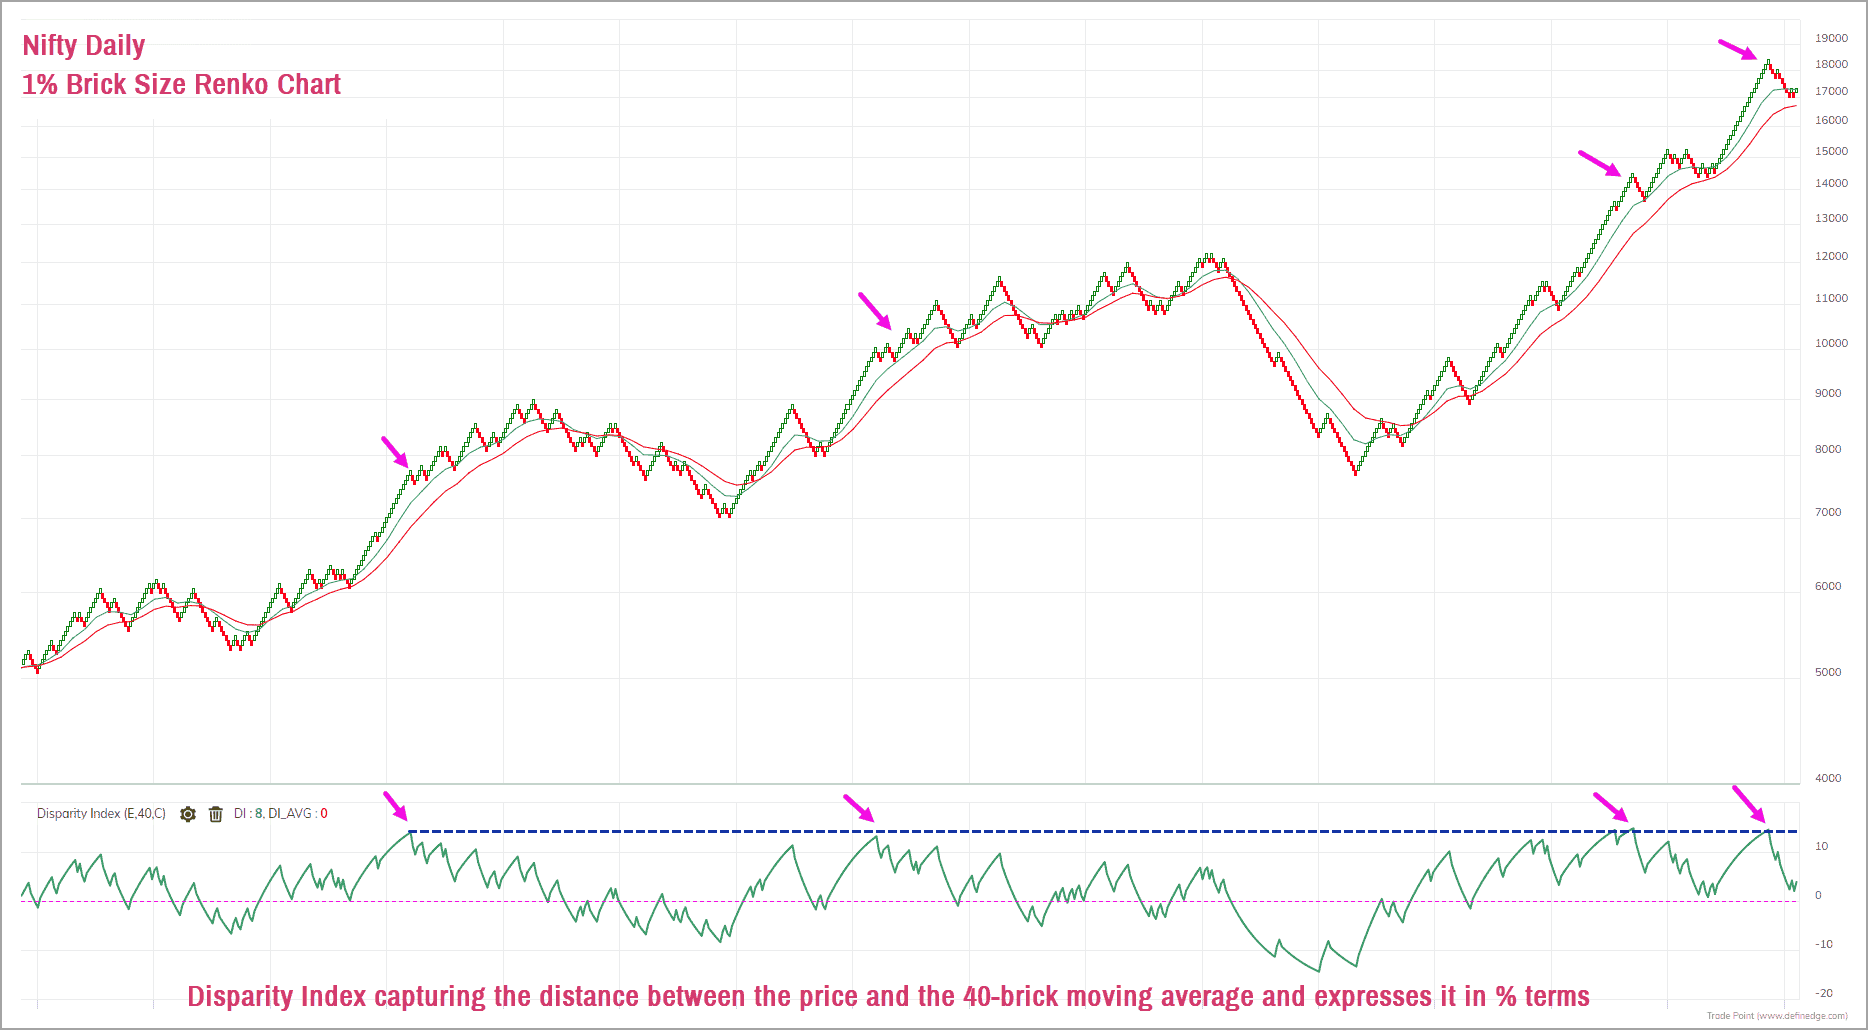
The Disparity Index is displayed in the lower pane in the above chart. Notice how the price has displayed the same tendency to pull back to the moving average when the Disparity Index reached a historically elevated level. In fact, the recent correction in November has helped the price revert to the moving average.
Therefore, the short-term picture is relatively bullish or positive. The recovery that commenced about a week ago could extend further on the upside. A move past the short-term resistance at 17,600 could pave the way for a rise to 18,100-18,300 zone.
The short-term breadth indicators are also supportive of the short-term up move. We shall use the PF-X% breadth indicator to study the market breadth. This indicator captures the percentage of stocks that are in a bullish swing in the Point & Figure chart.
In the short-term timeframe (using 1% box size), the recent rebound in the Nifty 50 index has helped the PF-X% breadth indicator to recover from the oversold region and is currently positioned at 66%. Any reading above 75% would indicate overbought condition. The PF-X% breadth indicator in the next higher time frame (captured using 3% box size in Point & Figure Chart) is at a deep oversold level of 18%.
The short-term and slightly higher timeframe breadth indicators are not overbought and are hence supportive of a short-term bounce in Nifty 50 index. The price chart too (in 1% brick size Renko chart) is bouncing off the moving averages and is no longer overbought. So, the breadth and price action are supportive of a short-term bounce to the next resistance at, as mentioned above, the 18,100-18,300 zone.
Let us also consider another short-term breadth indicator, which calculates the percentage of stocks trading above their short-term 20-day moving average from the Nifty 50 basket. This indicator has again turned around after hitting oversold levels. Multiple breadth indicators have displayed improvement even as the Nifty 50 index recovered sharply off the November 29 lows. The recovery in price along with an improvement in breadth is a healthy sign and supports the short-term positive outlook.
Can the Nifty 50 index make a new life-time high?
Well, that is possible too, but it is not the favoured scenario for now. And, even if the index makes a fresh high, it would not obliviate the possibility of a pull back to the moving average in the longer timeframe as we discussed at the outset.
Before I wind-up, let us take a quick look at the broader markets, captured by the Nifty Midsmall Cap 400 index. The long-term breadth indicator, measuring the percentage of stocks trading above their 200-day moving average, has recovered from 57% on November 29, to current level of 68.5%. This is a healthy sign indicating broader market participation along with the recovery in the Nifty 50 index.
And more importantly, the Nifty Midsmall Cap 400 index has resumed its outperformance versus Nifty 50 index in the short-term time frame. If you are a momentum or swing trader, you may choose to focus on the broader market for short-term opportunities.
To sum up:
- In the long-term price chart, the Nifty 50 index is still overbought condition, favouring a cool off or correction. This correction need not happen immediately, and could either happen via a sharp fall in price similar to March 2020 or through a prolonged sideways movement.
- In the short-term, the price and the breadth indicators are favouring short-term recovery or bounce. Immediate target is 18,100 – 18,300 range. This view would be invalidated if the price falls below 17,600.
- Stick to your regular SIPs and do not fiddle with it. Similarly, if you have a cash stock portfolio and an exit plan, just stick to it.


5 thoughts on “After the correction, what’s next for Nifty 50?”
Dear team,
How to upgrade my membership . Iwant to upgrade from essential to prime but not unable to find upgrade link
Thanks
Tarak pandey
Hello Sir,
We have raised a ticket and responded to your query. Kindly check your inbox for the same.
Regards,
Gaurav Menon
A very informative article. Thanks!!
what else you need on Monday morning !!
Thanks Krishna for your detailed view about market
Hello:
Glad that you found the post informative.
Regards
B.Krishnakumar
Comments are closed.