In our previous update on the Nifty 50, we had indicated that the short-term outlook for the Nifty 50 index was bearish and a drop to the March lows of 15,900 was likely. The subsequent price action has been in sync with our expectation and the Nifty dropped to a low of 15,735 last week. The key question is now is whether the worst is over and whether we are now headed to fresh highs in the Nifty.
We shall address this Nifty 50: what now question in two parts. We shall begin with the short-term outlook and then we shall revisit the long-term outlook as well.
Short-term outlook
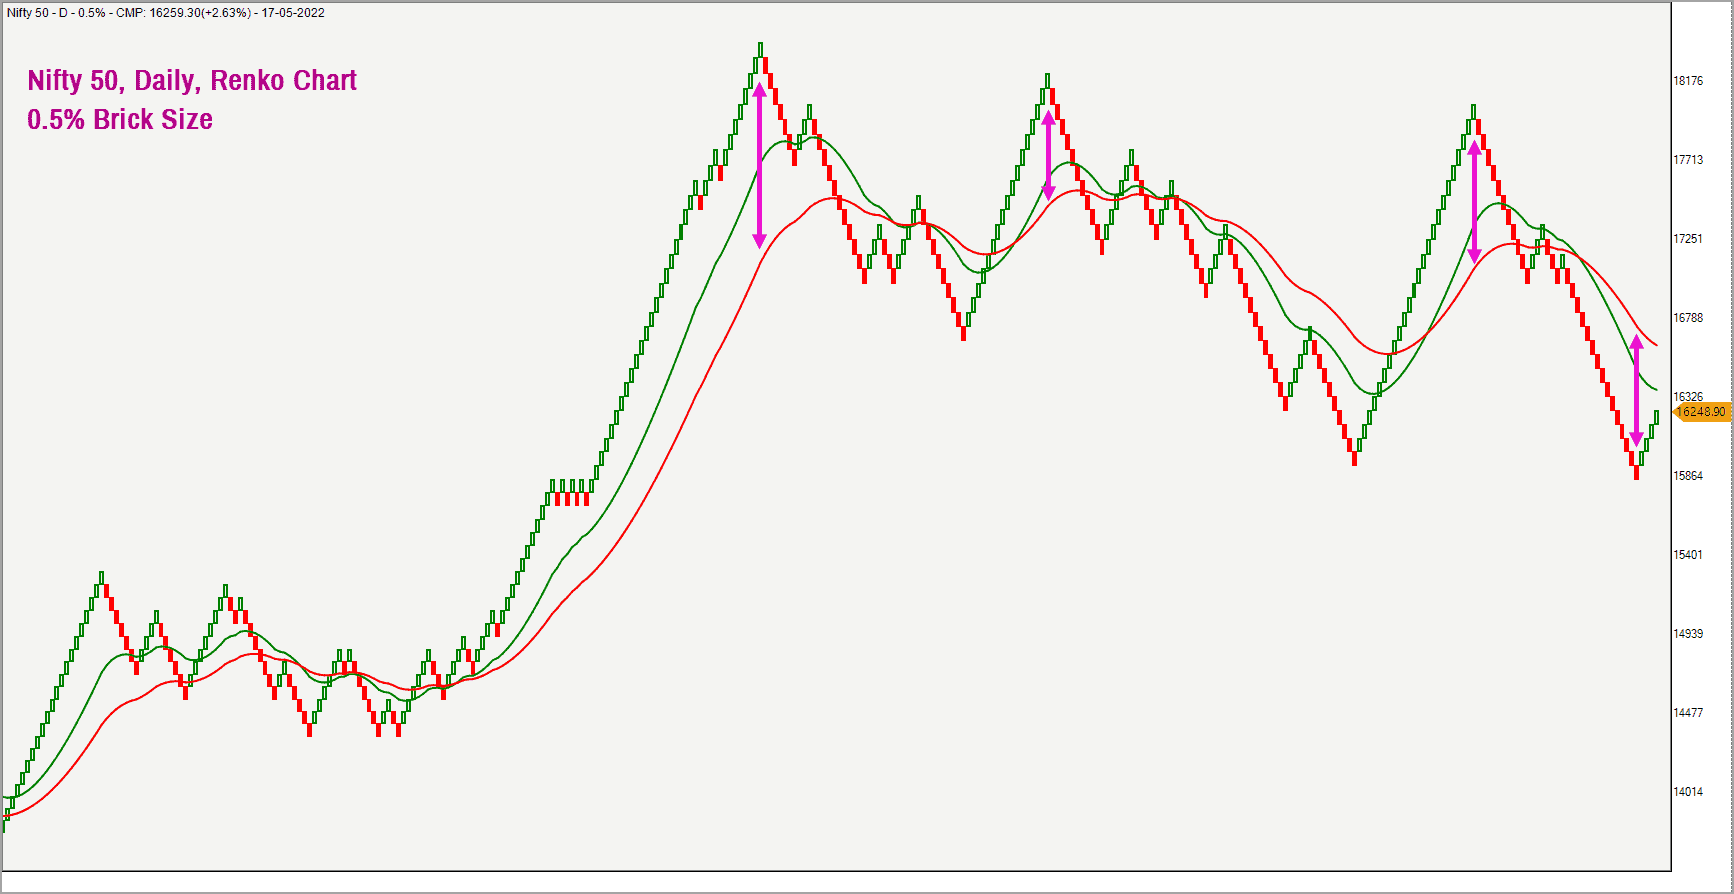
The recent fall in the Nifty 50 index has pushed the price to an extreme oversold condition based on price action as well as short-term breadth indicators. Have a look at the short-term Nifty 50 Renko chart plotted using the 0.5% brick size.
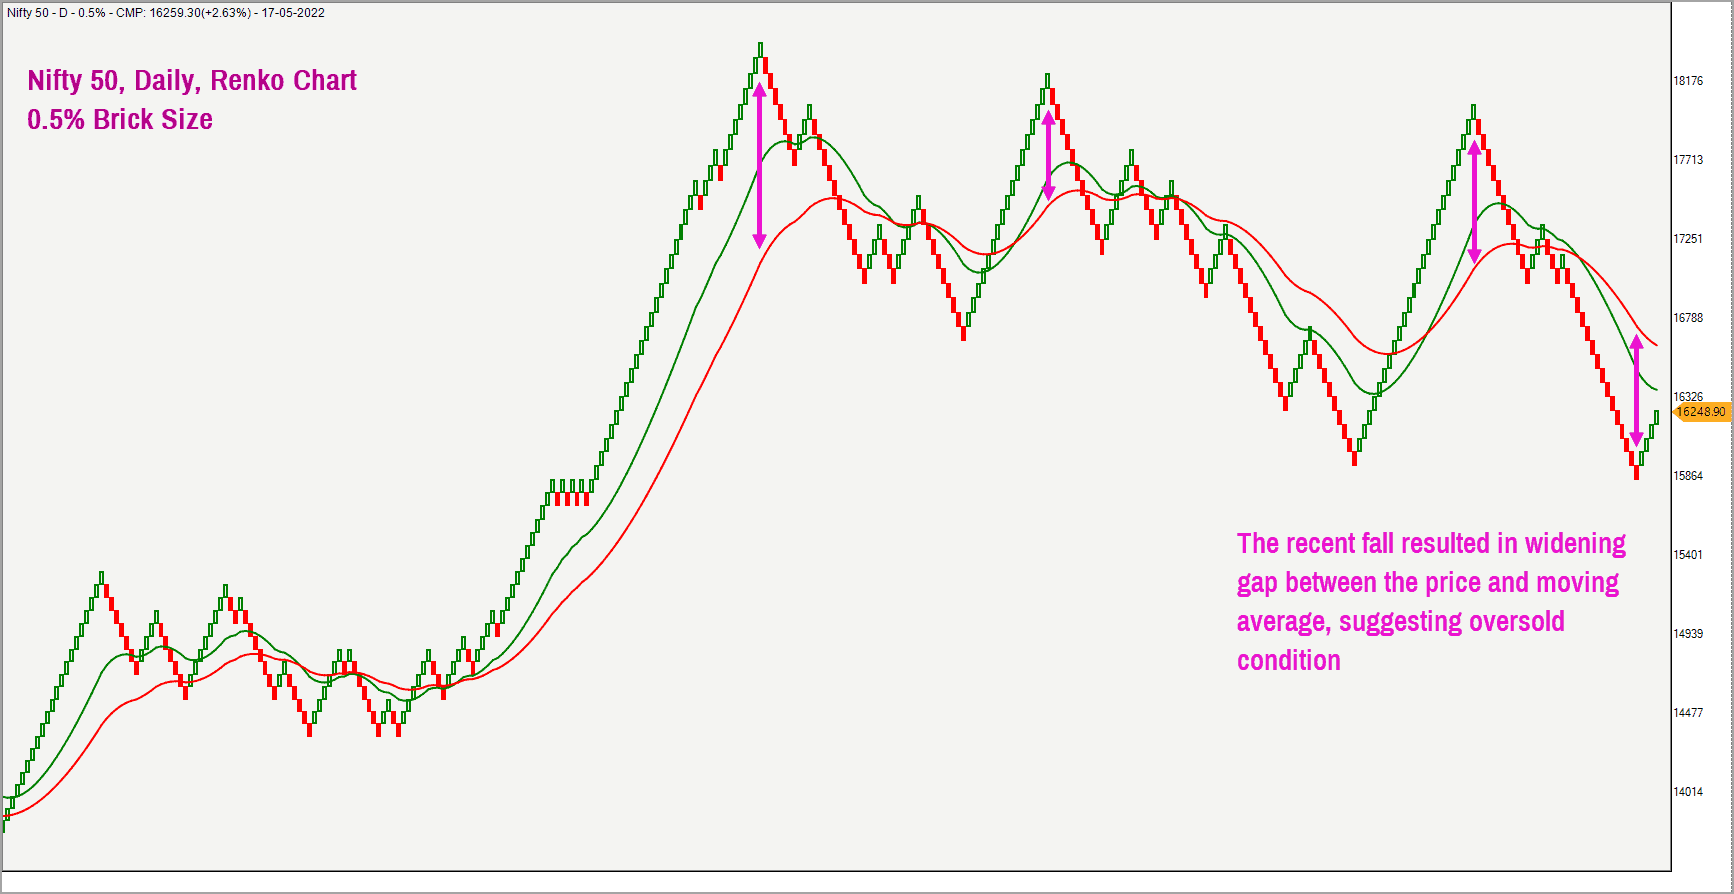
As highlighted in the above chart, the recent fall has pushed the price farther away from the moving averages, indicating extreme oversold condition. It is not uncommon for the price to get into a sharp mean reversion move from such an extreme zone. Regular readers may recall that we have been calling for a mean reversion move down in Nifty for several months now. The logic is the same in both instances.
The oversold scenario did trigger a sharp rally on Tuesday with the Nifty closing 2.6% higher at 16,259.3. The question now is how far this rally can extend. To address this, let us drill down to the 5-minute chart of the Nifty.
The erstwhile support at 16,900 was breached in the recent fall and that broken support is likely to act as resistance for the Nifty. This level of 16,900-16,950 would be the immediate target for the index. A move past 17,150 could push the index to the major resistance at 17,370-17,450 zone.
A quick look at the breadth indicator supports the case for a short-term bounce. As always, the breadth indicator of choice is the PF-X% indicator in the Point & Figure chart. This indicator captures the percentage of stocks that are in a bullish swing in the Point & Figure chart. The PF-X% breadth indicator, in the 1% box size chart, was at an extreme oversold region of 4% last week and has since improved to the current level of 58%.
The improvement in the market breadth indicates that the rally on Tuesday was broad-based with a greater number of stocks participating in the rally from the Nifty 50 universe.
The breadth has just turned around from oversold level besides moving past the 50% mark – a positive sign and one that suggests the rally can cover a little more ground to the upside. A look at the medium-term breadth using the same indicator but in a bigger box size of 3% indicates a similar scenario. This 3% breadth indicator too dropped to an oversold reading of 24% last week, again supporting the case for a short-term bounce.
In a nutshell, in the short-term (2-6 weeks), both the price action and the breadth indicators are supportive of a short-term bounce. But the next logical question would be : if the correction is over and are we headed to fresh highs?
To address this question of what now for the Nifty 50, let us take a quick look at the long-term charts.

Long-term Nifty 50 outlook
Here is the daily bar chart of the Nifty 50 index.
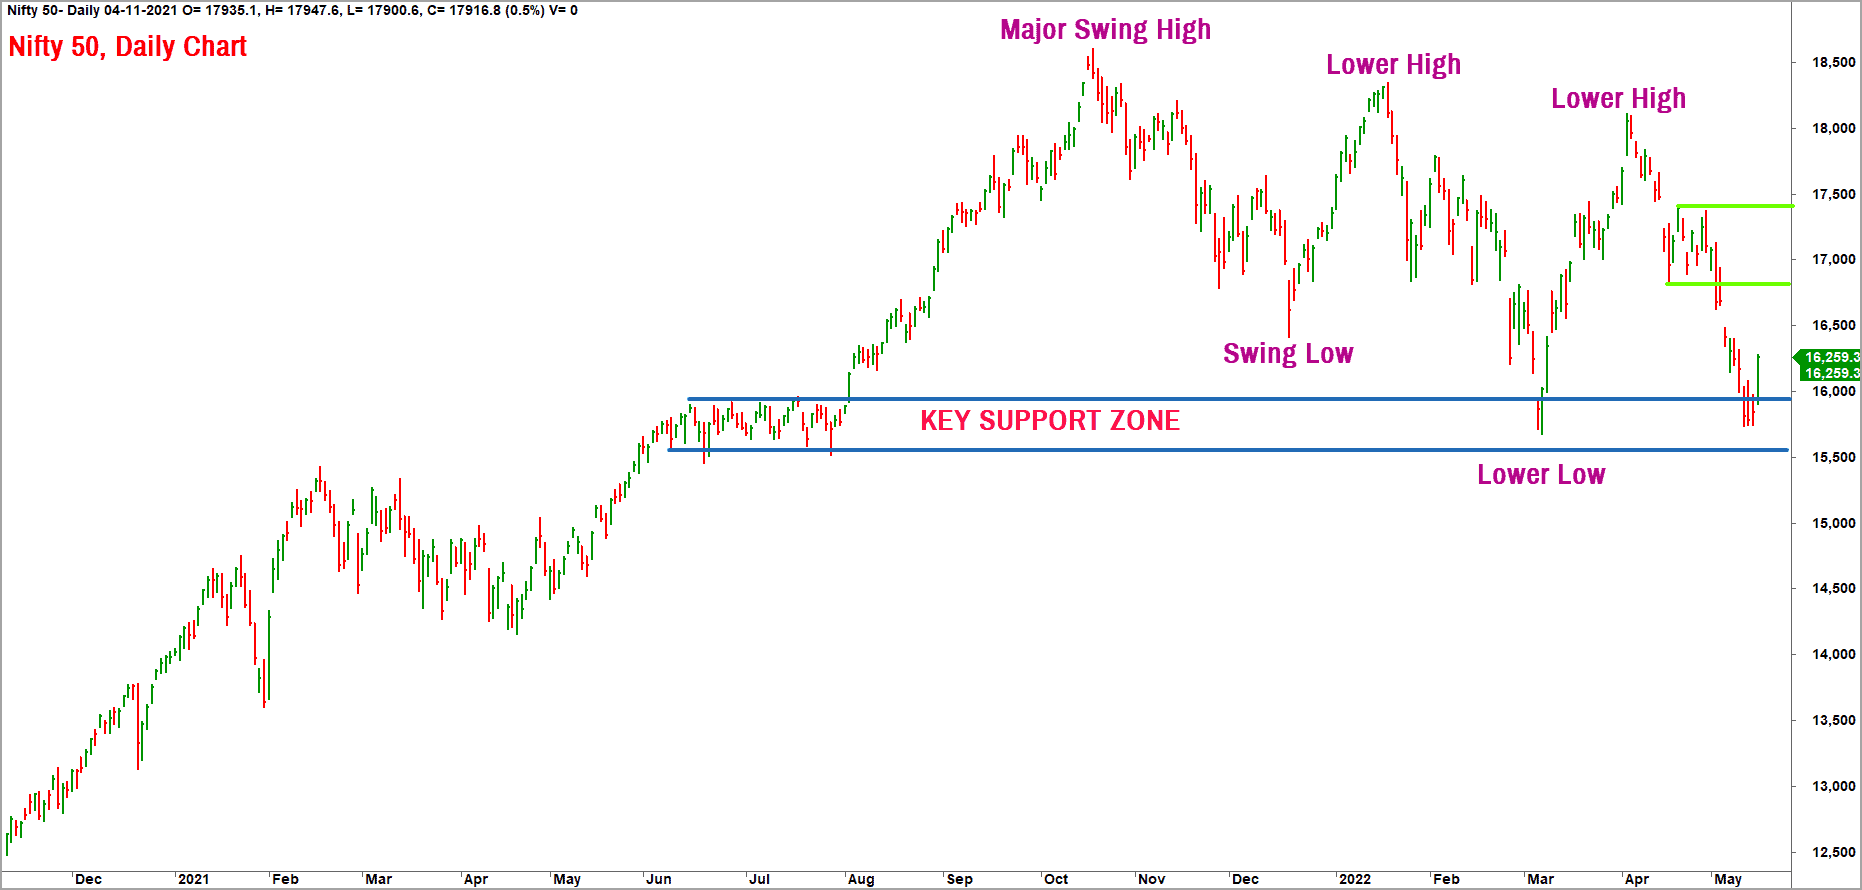
As highlighted in the chart above, the price has taken support at the prior consolidation zone. This is a common occurrence and using the same logic, the recent consolidation (highlighted by the green lines in the above chart) is likely to act as resistance. The green price zone at 16,900-17,400 is likely to be the key resistance zone. This zone is also highlighted in the Nifty 5-minute chart featured earlier above.
Unless the price moves past the immediate resistance at 17,450, there is no point talking about going to lifetime highs any time soon. This apart, the bearish sequence of lower highs and lower lows is still intact. Unless we get above the major swing high at 18,351, this bearish sequence will remain intact and there would be no merit in talking about higher targets.
A quick look at the long term Renko chart, plotted using the 3% brick size indicates that the price still has room to correct on the downside.
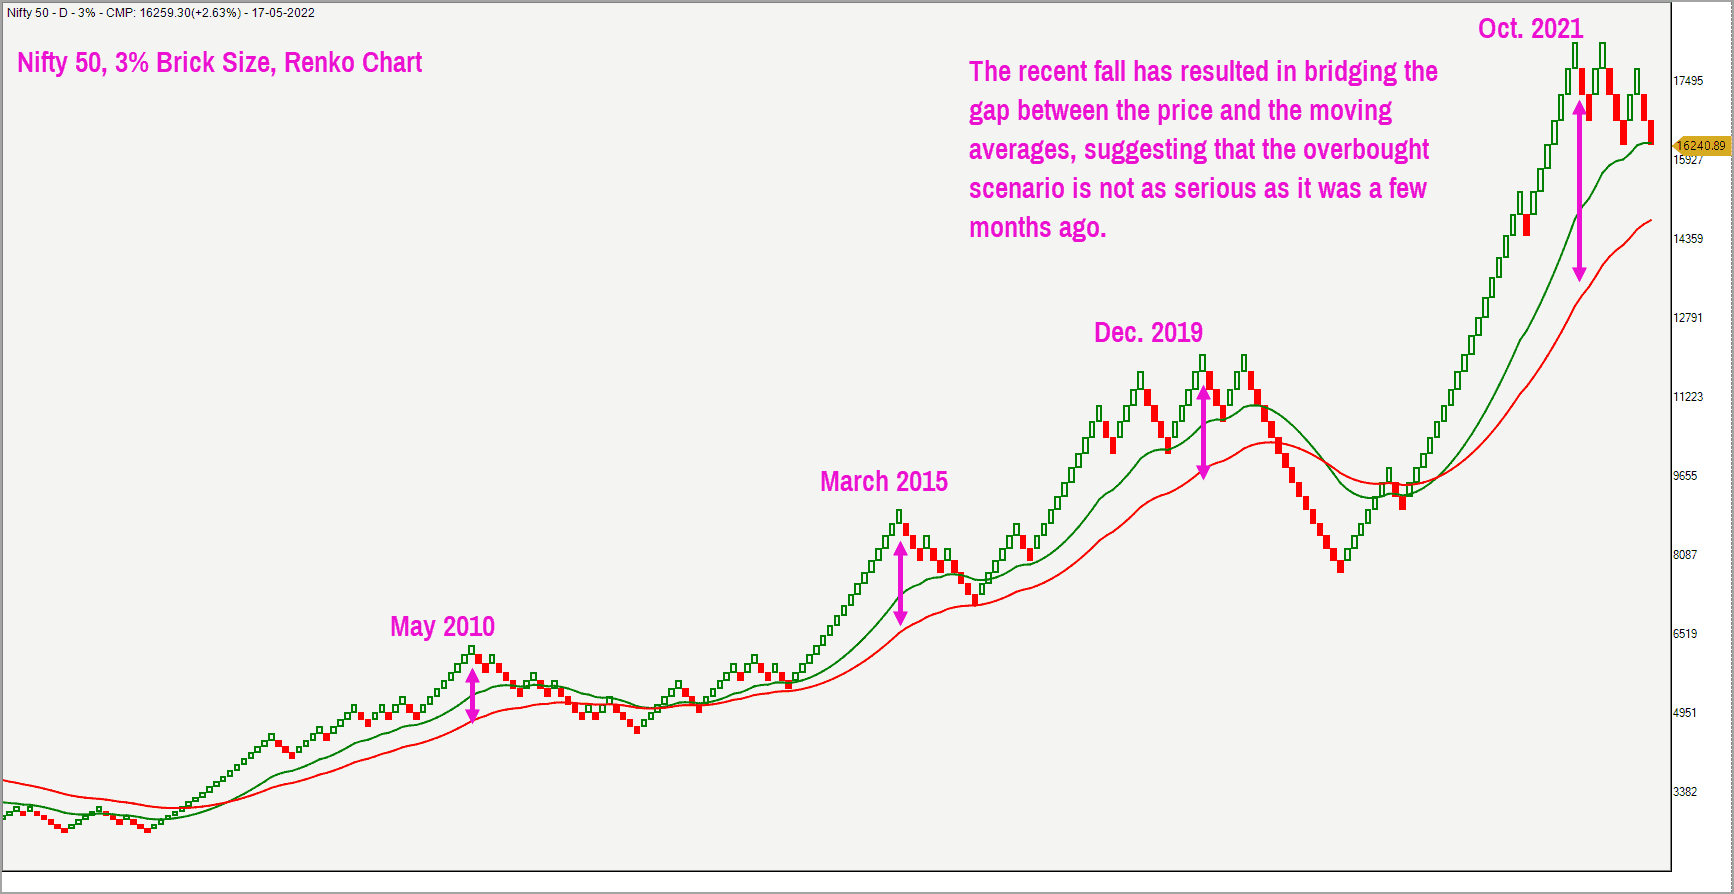
To summarise, the long-term charts are still overbought but not as overbought compared to the scenario 3 months ago. Hence, there is still scope for the price to make a lower low below the March low of 15,700.
Until the Nifty 50 index moves above 18,351, I would remain in the camp expecting one more leg of fall after the anticipated short-term rally is over. We shall come up with an update if the Nifty moves past 18,351 or if it drops below 15,700.

Sector observations
With the correction in the Nifty 50, it’s also worth noting moves in other key sectors. The Nifty IT index is at an oversold region and could see a short-term bounce. The Nifty FMCG index and Nifty Metals are the other interesting sectors to look at, from a short-term (2-4 week) perspective.
But a key market sector is banking, which has a big influence on the Nifty 50. A quick look at the Nifty Bank index shows that, similar to the Nifty 50 index, the recent fall has pushed the Nifty Bank index to an oversold territory, justifying the case for a short-term bounce.
The immediate target-cum-resistance for the Nifty Bank index is in the 35,800-36,900 zone. The index has to move past 39,500 to justify the case for looking at higher targets. Until the price moves above the 40,000-mark, the possibility of a slide to 30,500 or lower, cannot be ruled out.


9 thoughts on “Nifty 50: what now?”
Would appreciate if an updated analysis for nifty 50 is published now
Hi, in the present scenario I think it would be appropriate if you could issue a revised nifty Outlook over the weekend. Continue the good work….
BKK
we closed at 15774 (13th June) and very close to the 15700 mark, which you said you will be your trigger to give the next outlook. Nifty IT too got hammered as you predicted. Awaiting the next update. I hope that you don’t have to really keep waiting for 15700 lakshman rekha….
Kalyan
Infact, Intraday low was 15692, well below the mark that you had said 15700…and I am hoping that you will update us with your next view on Nifty. I would request you to also focus on all the other Nifty indexes, like Nifty IT, Bank nifty, Nifty Pharma etc….and all of them look as if they had swallowed a complete can of strawberry cream
Nifty is meandering around a range, where it seems to be waiting for triggers from US markets. This is the time for you to tell us, where it is headed (not after when everything becomes clear). the usual phrase ‘let us see how this plays out’ makes me laugh since afterall, you are supposed to come out with prediction ahead of the curve and not wait for every trigger to play out
Hello:
We shall come up with the Nifty update sometime next week. I wish to write a post when there is clarity of thought. I do not have a crystal ball to “predict” what Nifty will do. I am sharing my analysis on Nifty based on reliable data points including price action & breadth. There will be times when I prefer to wait for a bit longer to get a high probability view on Nifty. When the data points do not convey anything clearly, one has to resort to sharing twin scenarios.
Personally, I wish to avoid such twin scenario possibilities and wish to stick my neck out about likely direction and likely targets. At the moment, there is no clarity from data points I study regarding the high probability occurrence in Nifty. I therefore felt there is no point in writing a post “saying either this can happen or something else can also happen”.
For now, await a fresh update on Nifty soon.
Regards
B.Krishnakumar
Always, enjoy reading articles on the index Nifty50 !!
Excellent post, Mr Krishnakumar. Very clear articulation from a technical standpoint. Enjoyed reading this perspective and possible scenarios.
Hello Venkateswaran:
Glad that you found the post informative.
Regards
B.Krishnakumar
Comments are closed.