![]() In our previous Nifty 50 index update, we had built a case for a short-term bounce in the Nifty 50 index that could extend up to 16,800-16,850 range. This price action unfolded in line with expectations and the index moved well past the target zone. The question now is, will this rally continue or is there still a risk of one more leg of downside heading back to the early March lows.
In our previous Nifty 50 index update, we had built a case for a short-term bounce in the Nifty 50 index that could extend up to 16,800-16,850 range. This price action unfolded in line with expectations and the index moved well past the target zone. The question now is, will this rally continue or is there still a risk of one more leg of downside heading back to the early March lows.
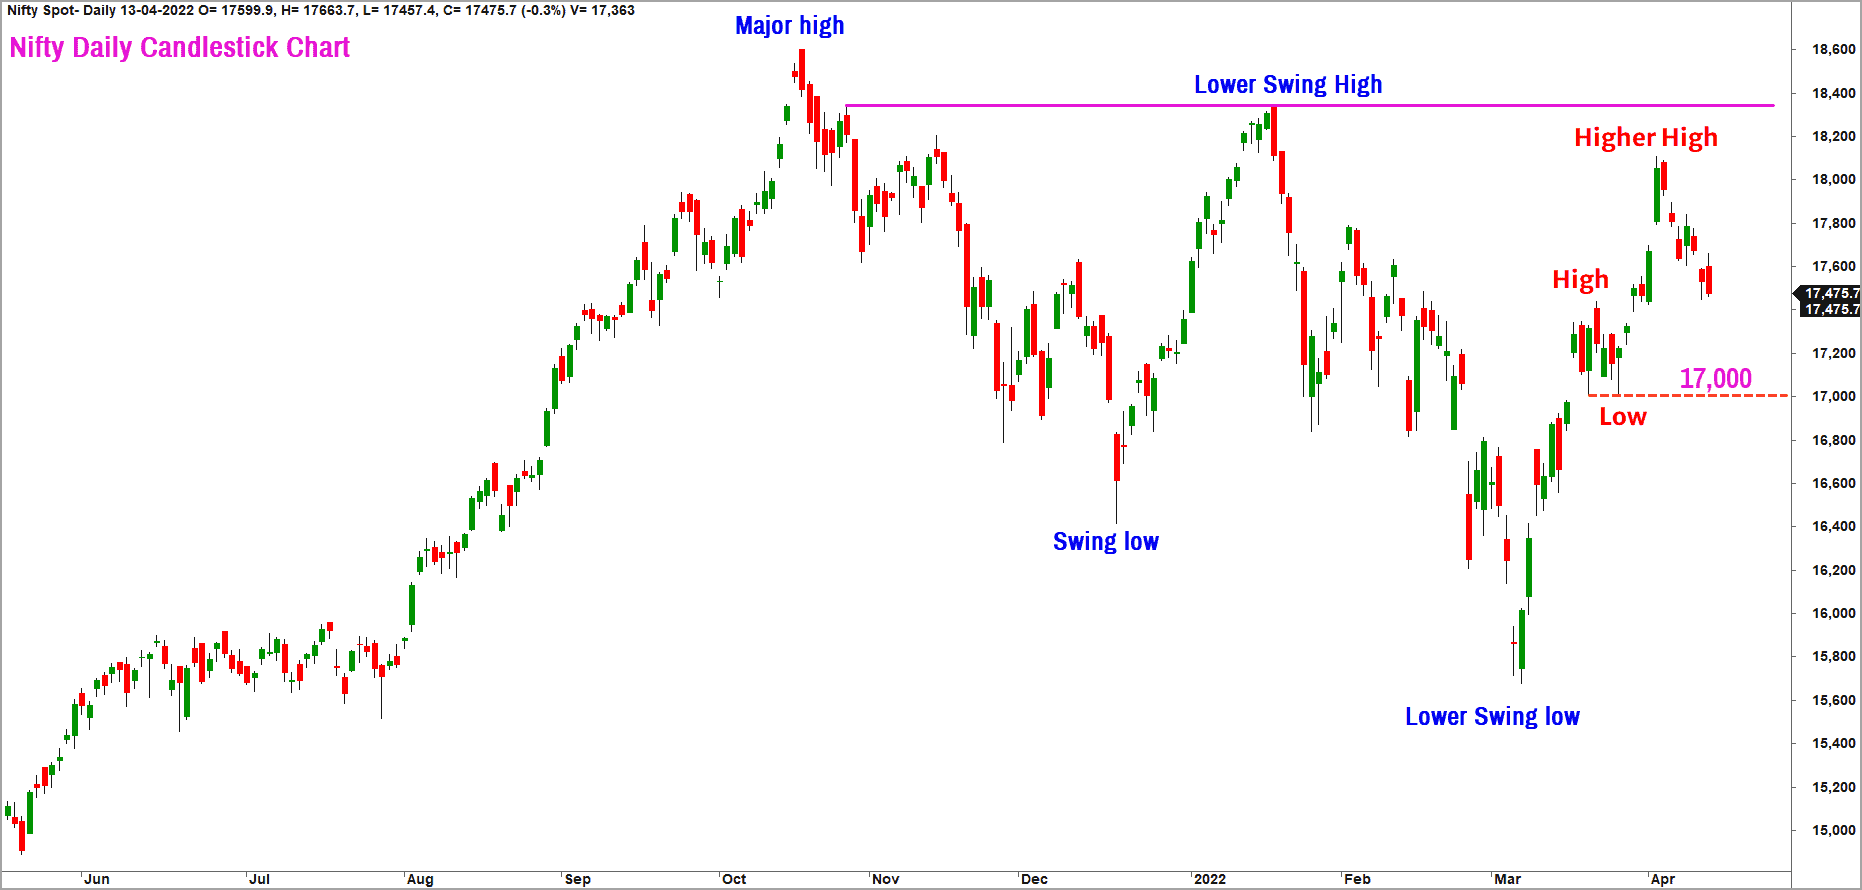
Let us again address these questions using the evidence available from the candlestick, Point & Figure and Renko charts. For a change, let us look at the daily candlestick chart of the Nifty 50 index.
Lower highs and lower lows
As highlighted in the chart above, the price is still tracing out a bearish sequence of lower highs and lower lows in the chart. The Nifty 50 index has to move past the swing high at 18,351 to violate the bearish sequence of lower high and lower low. The major swing highs and swing lows are marked in the blue font in the above chart.
If you notice, there is a smaller degree swing marked off the March low. The price has completed a higher high pattern which is highlighted in the red font in the chart. It would be interesting to watch what the price does going forward. For the bullish scenario to play out, the price must complete a higher swing low and then move past the major swing high at 18,351. If this sequence plays out, there would be a strong case for a rally in the Nifty 50 index to the major target at 19,100-19,200 range.
Personally, an immediate rally to the 19,100-19,200 range is not my preferred outlook. As we have observed in prior posts, the long-term charts are still at an overbought zone, suggesting the scope for correction or consolidation in price.
Preferred Short-term Outlook
Let us take a quick look at the chart patterns and the market breadth to understand the short-term outlook for the Nifty 50 index. Here is the 5-minute chart of the Nifty 50 index plotted in the Renko chart format using the 0.2% brick size.
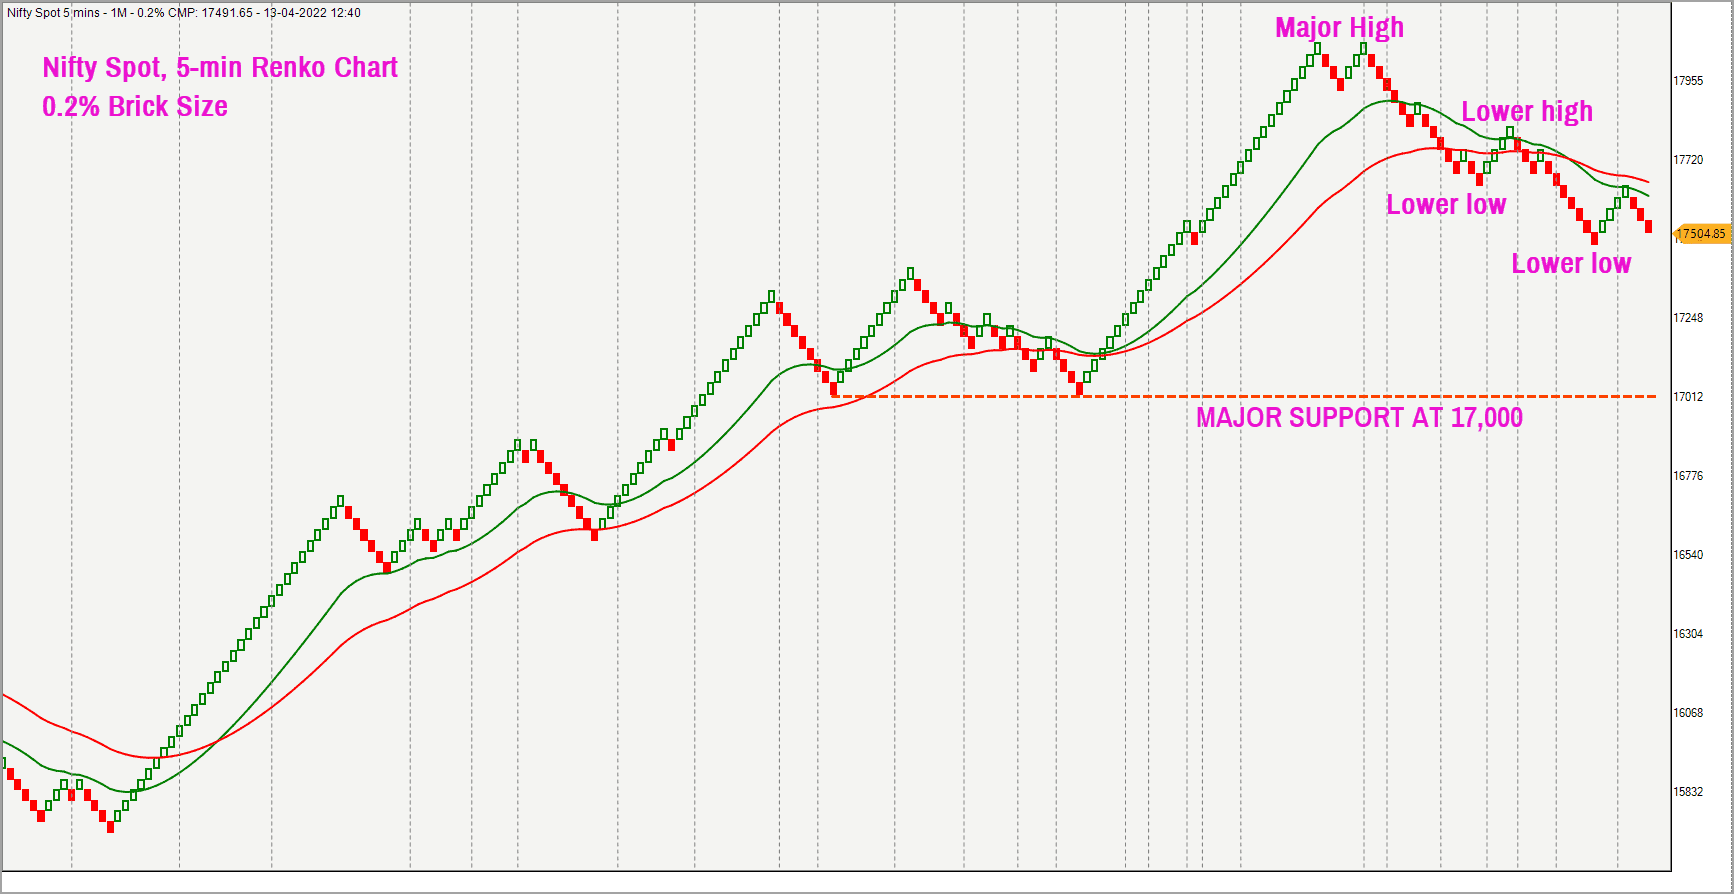
As highlighted in the chart above, the price is tracing out a bearish sequence of lower highs and lower lows in the short-term time frame. The moving average in the above chart is also negatively aligned with the short-term moving average positioned below the long-term average.
The major swing low and support is at 17,000. A breach of the 17,000 level would suggest that the price has resumed the next leg of the downside and a retest of the March lows is likely.
A retest of the March lows at 15,900 would be the preferred view as long as the price stays below the major swing high at 18,351. A look at the breadth indicator seems to support the case for a short-term down move.
The breadth indicator of choice is PF-X% indicator in the Point & Figure chart. This indicator captures the percentage of stocks that are in a bullish swing in the Point & Figure chart in the 3% box size. This indicator is at an overbought level of 80% which supports the case for a short-term weakness in price.
The PF-X% indicator in the short-term time frame (calculated in the 1% box size chart) is cooling off after peaking at an overbought level of 98% on March 21, 2022. The indicator is in a downtrend and currently positioned at 56%.
Before we wind up, here is a quick look at the long-term 3% brick size Renko chart of the Nifty 50 index. As highlighted in the prior posts, the price is still overbought, evident from the wide gap between the price and the moving average.
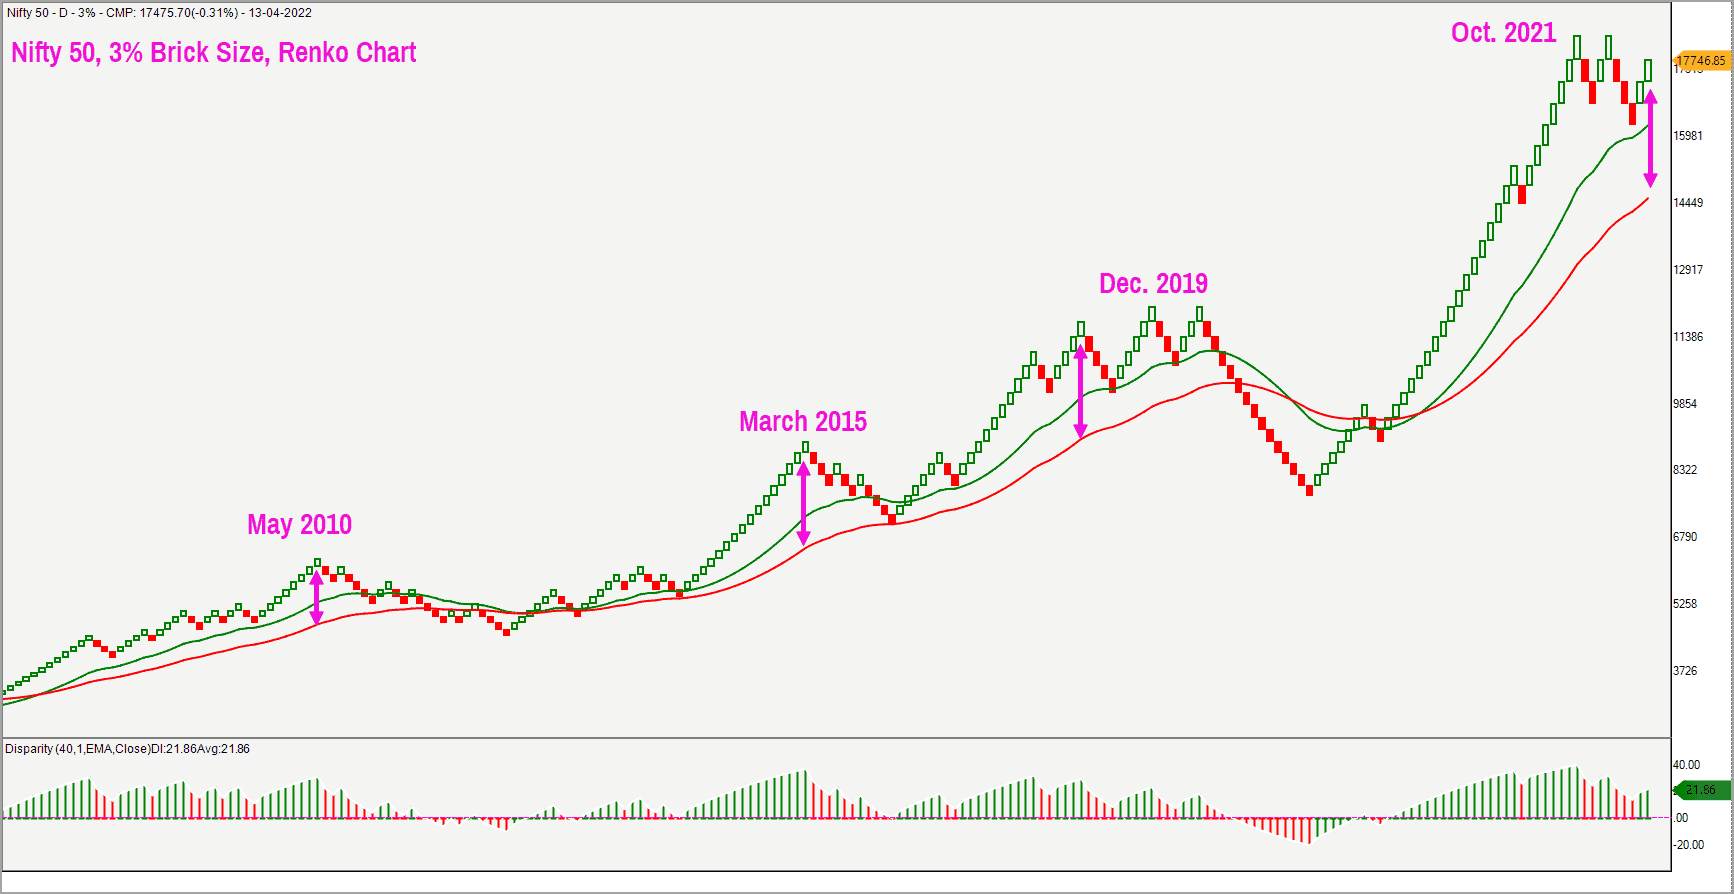
As highlighted in the above chart, the price is still some distance away from the moving average, indicating an overbought scenario. In prior overbought scenarios, the price has displayed the tendency to revert to the mean or the red-moving-average. A similar pull back to the moving average is likely to play out this time too.
Summary
- To summarise, the long-term charts are overbought and supportive of a pull-back.
- The market breadth measured using the PF-X% indicator (3% box size) is overbought, supporting short-term correction in price.
- A fall below the immediate support and swing low at 17,000 strengthen the case for a drop to March low of 15,900.
Until the Nifty 50 index moves above 18,351, I would remain in the camp expecting a fall to 15,900. We shall come up with an update if the Nifty moves past 18,351 or if it drops below 15,900. Sector wise, the Nifty IT index is still overbought in the bigger time frame and is vulnerable to short-term correction. We had shared a bearish view on the Nifty IT index in an earlier post. Here is the link to the post : https://www.primeinvestor.in/technical-outlook-nifty-50-and-nasdaq-100/.
It was mentioned in this post that the Nifty IT index is displaying signs of weakness and could slide to 28,000-28,500. This view remains valid. Given that relative performance of the IT index is deteriorating versus Nifty 50, there is a case for the IT Index to take the lead in dragging the Nifty 50 index lower.


2 thoughts on “Nifty 50: Will there be a pullback now?”
Now that nifty did fall to 15900 and went below it. An update from your end would be appreciated.
Hello Anish:
We will come up with an update very soon.
Regards
B.Krishnakumar
Comments are closed.