“Is this a good time to invest in the market?” This is a question that many of you ask us when you want to deploy additional money. Gauging market mood is never easy and this is often done mostly by short-term traders. When investing for the long term, we typically tell you that it is best to invest in phases and avoid trying to time the market. Investing in phases (or call it SIP) and holding for the long term can help contain downsides and it is a proven strategy.
But running a SIP does not guarantee high returns! And just because you hold an investment for 5 years does not guarantee high returns, either. Unfortunately, there still remains a large element of chance based on when you enter the market.
This is because, when you invest in sustained periods of high market levels, you are not averaging much on the downside. As much of your investment happens when markets are rallying, the returns can be mediocre.
This is where timing entry into the market (in addition to the SIP you may be running) helps boost returns. But your question would be that we’ve been telling you it’s impossible to time the market! Well, yes, peaks and troughs are known only in hindsight. But studying market movements/trends can offer insight into understanding whether current market conditions line up for healthy or mediocre returns.
That’s what we have done with our Nifty VMI market mood tool, an indicator that tells you if it’s a good time to invest in the market. With the Nifty VMI, we are trying to provide you with some indicators that will be of help in timing your investments in the market.
This tool is unique for its ability to not exit the market too early (which many market mood tools suffer from) nor enter markets on high euphoria – like momentum tools tend to!
Before we get into explaining the Nifty VMI and how to use it, let us explain how this problem is typically approached in most places.
Fundamental-driven or momentum-based investing?
Fund houses and research platforms solve the market timing problem in two ways:
- One, using fundamentals like price to earnings ratio or price to book ratio (the second one is slower to move and provides less dynamic signals)
- Two, shorter duration strategies using momentum-based indicators
Now let us take two of these separately.
Pure momentum-based investing can fail if you are oblivious to fundamentals. For example, if you participate in the peak of a market euphoria (where PE is high and momentum is high), your returns can be very low or even negative.
Take this example. For the past 20 years, the average 3-year rolling returns, had you invested during high market momentum (which is when you feel gung-ho) but at premium PE ratios, your returns would have been as low as 4.64%! Similar returns for a 5-year period were not great either at 6.78%. That is lower than even debt returns. And this is the most common scenario for retail investors who jump into the market at the fag end of a rally.
Now, let us take pure PE based investing. PE based investing does deliver alright! For the same three-year period mentioned above, investing at the low PE levels in 20 years would have delivered a good 17.2% returns. But here’s the downside:
- Such low PE opportunities are few and far between and need quick action.
- As market momentum can sustain even if PEs are no longer low, the low PE phase (call it the green zone) quickly disappears and you are given a signal that it is no longer conducive to invest, when it may still be fine to do so.
- That means you can lose out on the extra returns you can earn if you purely make decisions based on the PE alone (we will show this in the table further below)
- And markets are typically neither sitting pretty in the low PE zone or firmly in the high PE zone, where investment decisions are clear and easy to make. Markets are more likely to be somewhere between these two green and red zones, making a pure PE-based call tougher.
So, how do you, as a retail investor, decipher whether those are good periods to invest? This is where the Nifty Valuation Momentum Indicator (Nifty VMI) comes to your aid!

The Nifty VMI market mood indicator
The Nifty VMI Market mood indicator is a simple tool that combines the power of fundamentals and momentum to tell you whether it is a good time to invest in the market. It takes into account the optimal return scenarios and the least drawdowns in different PE ranges and different momentum levels. It uses this to indicate whether you should deploy money at current levels, assuming such trends repeat themselves.
Here are its features:
#1 Considers the time-tested price earnings valuation of the Nifty 50 index
In many models, you will see that a fixed PE valuation being used or a very long-term 10 or 20-year Nifty 50 PE average used to assesses whether market is over or under valued. However, this often suffers from redundancy as markets, the composition of the index, the valuation that market is willing to afford for those, besides rate cycles all change the PE ranges over time.
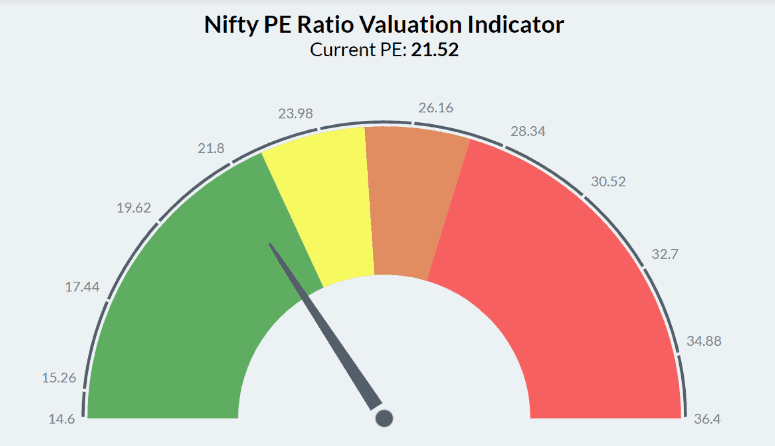
To overcome this limitation, we used a rolling 5-year PE average to ensure we stay on course with current market trends and use realistic PE benchmarks. The PE then would fit into 4 zones:
- Red – highest PE or high-risk period to invest
- Orange – near the highest PE and not a great time to invest
- Yellow – nearing low PE and a good time to start investing
- Green – lowest PE or best period to invest
These ranges are determined based on the deviation they have from the average PE for the latest rolling block of 5 years. In our recent indicator below, you will see that the arrow points to the end of green zone and closer to the yellow zone.
As can be seen from the table below, the green zone gives the highest return and red the worst. Clearly, you cannot ignore market valuations and expect that long-term investing alone will work for you!

#2 Adding momentum to the indicator
While the green and red valuation may seem like having a wide range (image above), the problem is that the probability of the market falling in such zones is low. In other words, the green opportunities may not last too long. Hence, it becomes important for us to understand the market mood through its momentum.
Momentum is nothing but the ability of a market trend to sustain itself in the future. We used the 21-day and 50-day exponential moving averages (EMA) to gauge the momentum level of the Nifty 50 and classified it into:
- Low momentum - Current Nifty level is below both the 21 and 50-day EMAs
- Partial momentum – Current Nifty level is above only one of the two EMAs mentioned above.
- High momentum – Current Nifty level is above both the EMAs
The image below shows how our tool indicates this.

But if you thought high momentum would deliver high returns, here’s the googly! The data below will tell you that even if you invested in the best PE zone or near it, at high momentum, your returns would have been significantly lower than in the low momentum period. Hence, if you simply go by momentum you may actually be hearing the tunes of the Pied piper – a delusive enticement that could well be a market trap at times!
Why does this happen? When market momentum is high, especially after sustained high rallies, it can mean that markets are drawing closer to their peak. If you invest in such a euphoric zone, the chances are that you would face a market fall fairly soon which would turn your returns mediocre (see the ‘Probability of losses’ table below). The converse is also true. When momentum is low and market valuations are low or near low, the market sentiment is that of fear – which actually makes it a safe zone to start investing!
And what’s more, the probability of losses in future is high when you start investing at high momentum. Here’s 1-year rolling return data for the same.
You can see that in general, the probability of losses is higher when you start investing in the high momentum zone, unless the PE is in the green.
#3 Combining PE and momentum
Our study of these return patterns is how we decided that combining momentum and PE makes a firmer base for investment decisions than relying on the individual metrics. When we back tested the 4 PE zones with the three momentum zones over the past 20 years (over 1,3 and 5-year periods), we could identify that markets worked best in the Green PE zone with low momentum and worst in the Red PE zone with high momentum. But we could also identify patterns where it was fine to invest even where the market was not in the green zone and still make reasonable returns.
Here’s how returns stacked up. As you can see below, the returns are best in the low momentum in different PE zones. They are decent when momentum is partial and the least in high momentum.
Pure PE investing Vs Nifty VMI model
Let’s go back to the start, when we discussed returns based on using purely the Nifty PE investing. Now that we know momentum makes a difference, let’s see how returns panned out when investing at different PEs but during a low momentum phase. In both 3 and 5-year returns you will see that combining the Nifty PE and momentum delivered returns that were higher by 0.5 to even 4 percentage points higher.
How the Nifty VMI Market tool works
We have created four quadrants to represent the output/interpretation of the model explained above. To explain, the Nifty VMI takes the current PE level and fits it into the zone. It then takes the momentum and fits it into the buckets shown above. Then, the tool asks you to choose the timeframe you have for investment, as the output can vary based on how many years you stay invested.
The result shown in the Nifty VMI is based on a risk-reward matrix, given the PE, momentum and your timeframe. The result tells you whether or not the market is conducive to investing now.
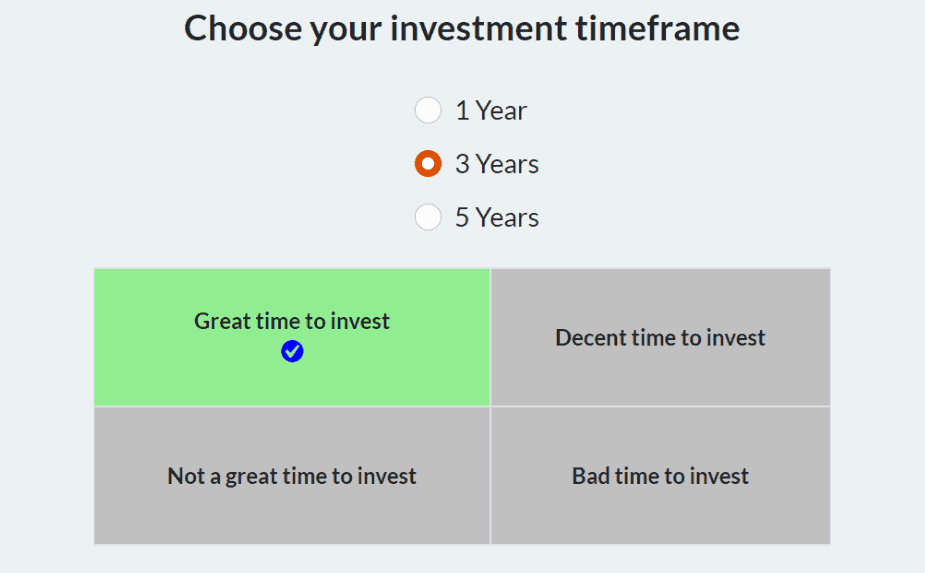
- Great time to invest: Both the Nifty PE ratio and market momentum are conducive to generate strong returns with a probability of very low loss or no loss, for the chosen timeframe. It means it is a good time to enter the equity market.
- Decent time to invest: Market valuations are not very attractive but return still holds reasonable potential and downside risks are limited in terms of the timeframe and based on the strength in the market momentum.
- Not a great time to invest: Nifty PE ratio and momentum are poised at uncomfortable levels that could lead to sub-par return potential and/or increased loss probabilities for the chosen timeframe.
- Bad time to invest: Both market valuations and momentum are not conducive to investments for the chosen timeframe, with a very high probability of sub-par returns and high risk.
How to use the Nifty VMI tool
- The Nifty VMI can be used as a starting point for fresh investment. If you are doing SIPs, this is not a tool to stop SIPs. You can at best use it to increase the SIP or more importantly to deploy additional lumpsums in lieu of SIPs.
- You can use it to invest in both stocks and mutual funds. Its best use case is to invest in index funds and ETFs.
- Since the tool is based on the Nifty 50 – which is a broad market index - this will broadly give the mood of the market. However, there will be times when market-cap segments like midcap and smallcap will behave differently. So, use it for more large//multi/Flexicap fund investing or index investing and for large and emerging-large cap stocks in your watch list.
- The Nifty VMI is not an indicator to book profits, sell, or exit your funds and stocks. It is an investment indicator only.
- Always consider your risk level and timeframe before making any investment.
At present this tool has the four -quadrant ‘ideal time to invest’ use cases. We soon plan to add tables that will also tell you the past returns such market entry points would have delivered. But do note that it is not an indicator of similar future returns 😊
Do try the tool and provide your feedback. Happy investing!
General Disclaimers & Disclosures


28 thoughts on “A new approach to gauge market mood – The Nifty VMI tool”
This tool is not displayed under Tools & Calculators. Please advise where this tool is available.
Swaminathan
It is listed as ‘Stock market mood’ under Tools & Calculators. – thanks, Bhavana
the VMI Market Mood tool shows today (19th Jan) as a great time to invest for 1 and 3 year time frame. For 5 year time frame it shows decent time to invest .. I always understood the bigger the time frame, the better it is for stocks portfolio..
– could you help explain the same..
Sir, what you are saying is right with fundamentals. But with momentum, when the momentum cannot last long, there will be instances where the momentum is favourable (even if fundamantals is not very attractive) in the short to medium term but the same cannot carry on at current valuations for the long term. In other words, there needs to be a correction to reduce fundamantal valuations for the metric to turn attractive for long-term investors.
Can you please alloborate more on below point.
“The Nifty VMI is not an indicator to book profits, sell, or exit your funds and stocks. It is an investment indicator only.”
I am trying to understand why it’s not an indicator book profits. And what is meant by “It is an investment indicator only”. When we can use for buying at low valuations and low mommentum, what might go wrong if use it for selling at high valuations and high mommentum?
Selling at high valuations will work with indices not with stocks and funds. With stocks the upside might exist based on its own growth potential and with funds, fund manager may be tweaking it already to reduce the high valuation. hence, the disclaimer. Vidya
Can you please help us understand the drawbacks of selling/booking profits when valuations are in RED zone and mommentum is high ? And re-invest those money when valuations come back to GREEN zone and mommentum low?
Just replied in earlier comment. Thanks!
Comments are closed.