In the previous update on the targets for the Nifty 50, the expectation was that the index could head to the next target at 19,100. Contrary to expectations, the index has been in a correction phase in the past few weeks.
In today’s report, thus, we try to assess both the short-term and the medium-term outlook for the Nifty 50 index.
To understand the medium-term outlook, we take a look at history and understand how the Nifty 50 index has behaved over the last few decades. We study the yearly drawdown behaviour of the index – a peak-to-trough decline in the chosen time period, which in our case is the calendar year.
Yearly drawdown
The table featured below captures the maximum drawdown witnessed in each calendar year from 1996. You may observe that out of 27 observations, Nifty 50 has witnessed a decline in excess of 5% in most of the years.
In fact, there are 25 instances (out of the 27 years under study) where the drawdown has been in excess of 10%. So, it would not be outlandish to expect a 10% correction from the peak in 2023 too. As an aside, the data from the US market indicates a similar behaviour. In the US, the S&P 500 index has seen a double-digit peak-to-trough drawdown in roughly two-thirds of all years dating back to 1928.
This indicates that equity as an asset class is prone to mean reversion. Mean reversion is just a fancy term to suggest that the price would pull back to the mean or the average. To simplify this even further, one may look at mean reversion as a tendency for the equity markets to cool off after a sustained rally or get into an upside pull back after a sustained fall.

Other indicators
If you look at the other technical factors, such a drawdown possibility is not entirely ruled out in 2023. The red flags highlighted in the previous outlook report still hold valid and could play a pivotal role in history repeating itself in 2023.
To begin with, the breadth indicator in the medium and long-term time frame have not cooled off sufficiently. As always, we shall use the PF-X% indicator as a tool to assess the market breadth. This indicator captures the percentage of stocks that are in a bullish swing in the Point & Figure chart.
To study the medium-term breadth indicator, we shall use the 3% box size chart. The PF-X% in the medium-term time frame has cooled off from the overbought zone but is yet to reach the oversold territory. It is still around the midway mark, suggesting that there is scope for the recent downtrend to continue.
The expectation of this correction continuing stems from the extreme overbought breadth in the long-term time frame. The PF-X% breadth indicator in 5% box size is still at the overbought zone at 82%. This indicator has remained overbought for several weeks now and a cool off is overdue.
Have a look at the chart displayed below capturing Nifty 50 index in the top pane and the long-term PF-X% breadth indicator in 5% box size featured in the lower pane. Except for pockets of slightly extended period of sustenance above the 75% mark, this breadth indicator has displayed a consistent tendency to cool off to the 50-60% mark or even lower.
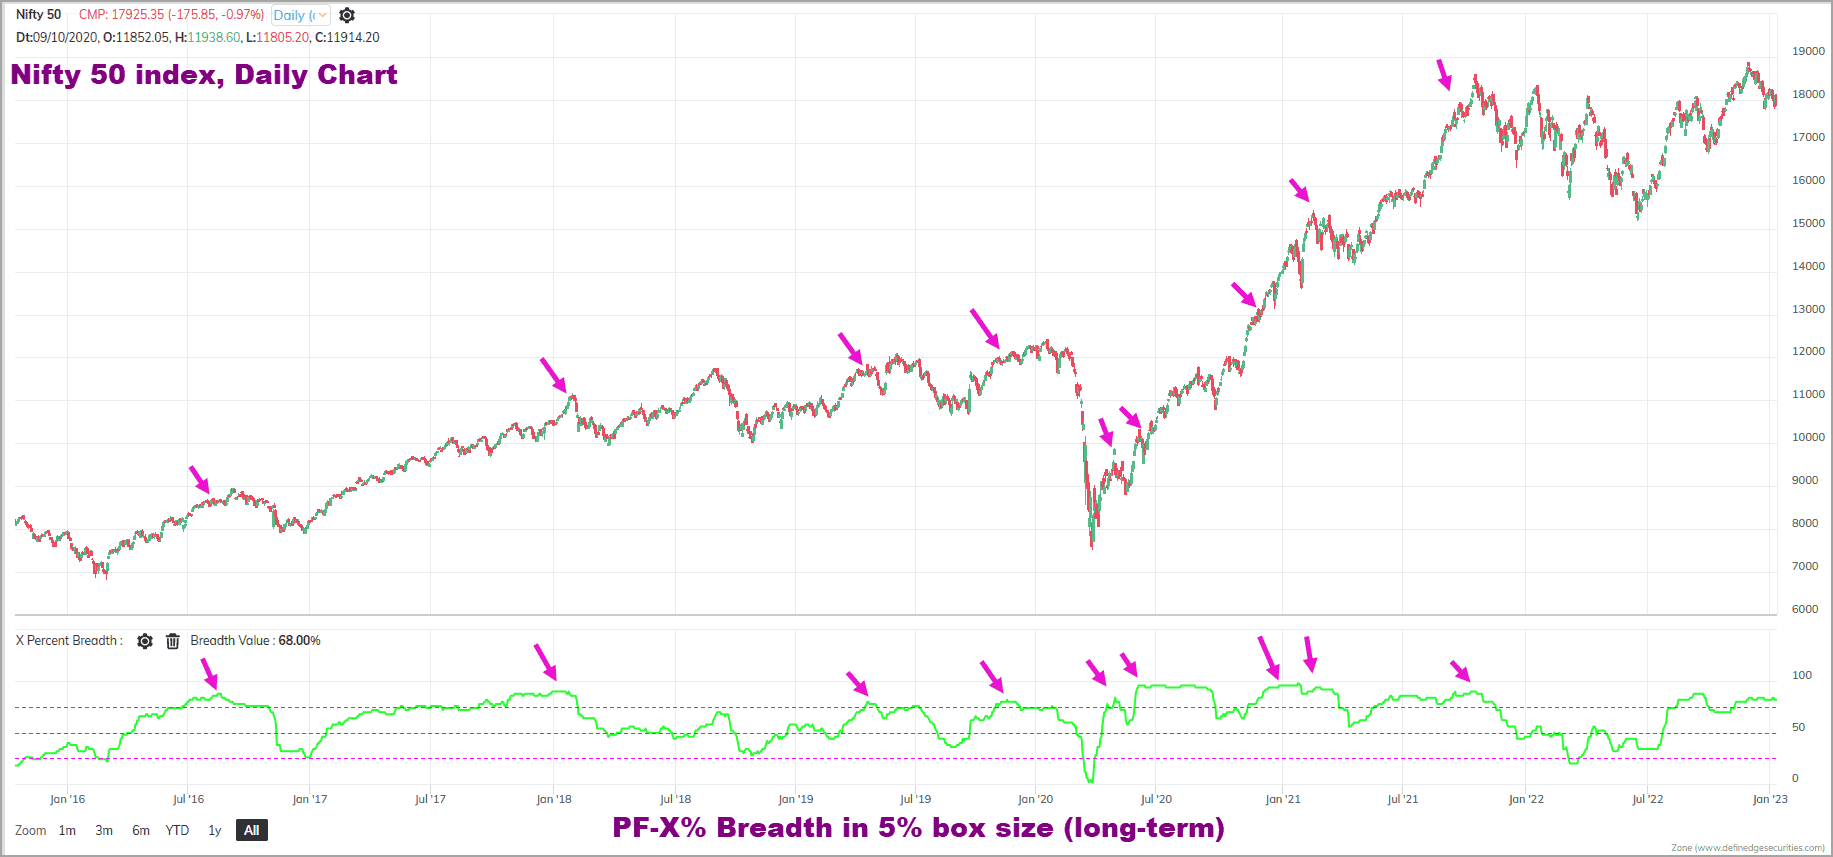
The recent price action in the daily time frame along with the historical peak-to-trough drawdown data are supportive of this cool off in breadth to happen sooner rather than later.
Short-term Outlook
In the daily candlestick chart, the Nifty 50 index is tracing out a bearish sequence of lower highs and lower lows. The preferred short-term view is a cool off to 17,150-17,200 range. A close below 17,800 would strengthen the case for a short-term slide to this target zone. While the short-term outlook does not appear too bullish, let us be aware of the other less likely possibilities too.
A move past 18,300 would break the above-mentioned bearish sequence of lower highs and lower lows. This breakout would have a positive implication and could propel the Nifty 50 to 18,650-18,700 range. In the ultra-bullish scenario, the index could head all the way to the target of 19,100 mentioned last month.
What can happen in 2023
For now, there is a strong case based on the breadth indicator and other technical studies to expect a correction. Whether this will happen straightaway or after an upside pull back is unclear.
Even if the bullish or the ultra-bullish scenario mentioned above were to play out immediately, remember that the index would still be vulnerable to a sharp downside correction thereafter. So, the only grey area is whether the correction will happen straightaway or after a sharp pull back.
Either way, a sizeable correction is a strong possibility and a test of 17,150-17,200 seems likely in 2023. It would be premature to discuss about the possibility of a fall below 17,150. We shall address it based on how the price action unfolds. As always, we shall come up with regular updates which would provide more clarity in terms of short-term targets.
As always, have an exit plan in place and implement it. If you do not have such a plan, it is about time to do so. We shall alert when the long-term breadth cools off. Such an environment would be an opportune moment to consider lump-sum investment in equity markets. The most recent cool off in long-term breadth happened in March 2022 and we are aware of what Nifty 50 did thereafter.
Similarly, long-term breadth was previously overbought (above the 75% mark) in October 2021 and there was a sharp correction thereafter. Even a cool off in breadth to the 50-60% zone (from the current reading of 82%), will be good enough to trigger a sizeable correction in the Nifty 50 index.
Be prepared for either the recent correction in the equity markets to extend a bit more or brace for a sharper cut later in the year is the broad message here.

Sectoral indices to watch in 2023
Now, let’s turn attention to the sectoral indices. Let's start with one key index that shone in 2023 – the banking space.
- The Nifty Bank index plays a pivotal role influencing how Nifty 50 index behaves. Unfortunately, the Nifty Bank index is yet to take the leadership mantle which is crucial for a sustained momentum in Nifty 50 index. The performance of both these indices have broadly been at par for several months now. From a technical as well as fundamental perspective, it is important for the bank index to display outperformance.
- For now, it is the PSU banking space displaying such outperformance while the private banks are still struggling. The Nifty PSU Bank index has been a top performer. Also an outperformer is the Nifty Metal index and these two indices remain outperformers.
- The other interesting sectors worth watching are the Nifty Auto, the Nifty PSE & the Nifty Oil & Gas indices. There are early signs of short-term outperformance of these sectors.
- The Nifty IT index has been struggling both price-wise and in terms of relative performance versus the Nifty 50 index. There is no point focusing on this index until there are clear signs of relative outperformance. We shall alert when there such signs of outperformance.
Let us await evidence of a clear outperformance of the Nifty Bank Index. We will alert once such signs are evident. Until then it would be better to have measured exposure in this sector and focus on outperforming ones listed above.


5 thoughts on “Technical outlook – where the Nifty 50 could be headed in 2023”
Hi Krishnamumar,
Thank you.
On Nifty corrections below 17500, Will it be good to go long on Nifty Bank with accumulation in a phased manner.
Thanks
Rajasekar.S
Hello:
I would not personally buy Nifty Bank until there are signs of out-performance of this index versus Nifty 50. Plus, I would prefer to wait for the trend in Nifty 50 index to turn positive. I want these two factors to be satisfied before committing funds. As mentioned in the copy, a better strategy would be to buy Nifty or bank nifty when the long-term breadth becomes oversold. We will alert readers when this scenario plays out.
Regards
B.Krishnakumar
Thank you, Krishna.
Hi thank you for the analysis. I want to put lumpsum in Nifty50. Based on the above could you please indicate a “tentative” level that would be appropriate for lumpsum. Thank you
Hello:
As explained in the post, I am personally waiting for the medium-term breadth to drop below the 25% mark. Once this happens, I would consider deploying some funds in the Nifty 50 index.
Thanks
B.Krishnakumar
Comments are closed.