A lot has happened since our previous market update, when we discussed if the worst was over for the Nifty 50. In that update, we had mentioned that the level of 17,850 on the upside and 16,900 on the lower end are the key markers to focus on. It was also highlighted that a breakout past 17,850 could pave the way for a rally to the 18,350-18,400 zone.
The Nifty 50 index has managed the latter, breaking above 17,850 and reaching the target zone of 18,350-18,400. The question now is what is in store for the Nifty 50 index. We will look at the short-term perspective here, to address this question.
Short-term outlook
Let us get started with the daily chart of the Nifty 50 index. As highlighted in the chart below, the index is tracing out a bullish sequence of higher highs and higher lows in the chart.
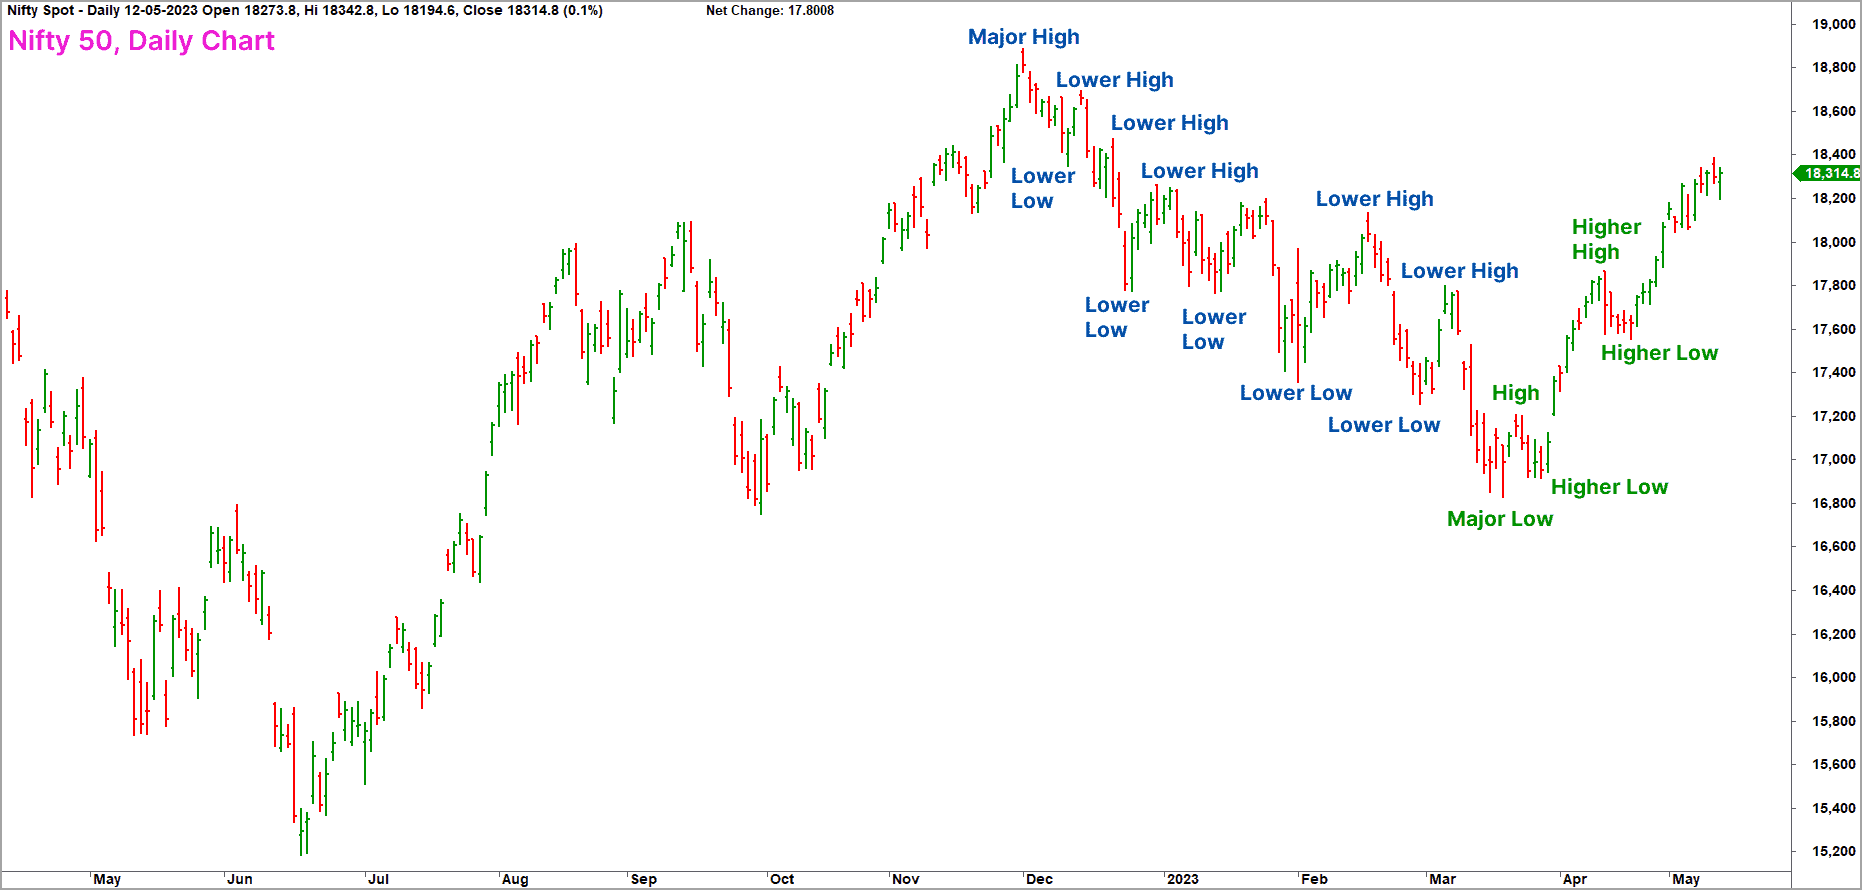
More importantly, the index has also moved past the prior swing high at 17,800, confirming the short-term bullish view. The behaviour of the short-term market breadth indicator corroborates the bullish view. Have a look at the Nifty 50 daily chart pasted below along with the PF-X% breadth indicator in the lower pane.

As highlighted in the chart below, when the breadth staged a recovery on prior occasions, the price action did not turn bullish. The Nifty 50 index could not break the bearish sequence of lower highs and lower lows during this fall. This is a classic sign of bearishness where the breadth is unable to stage any meaningful recovery while the price action remains bearish. Any recovery in breadth was not strong enough to break the bearish price action.
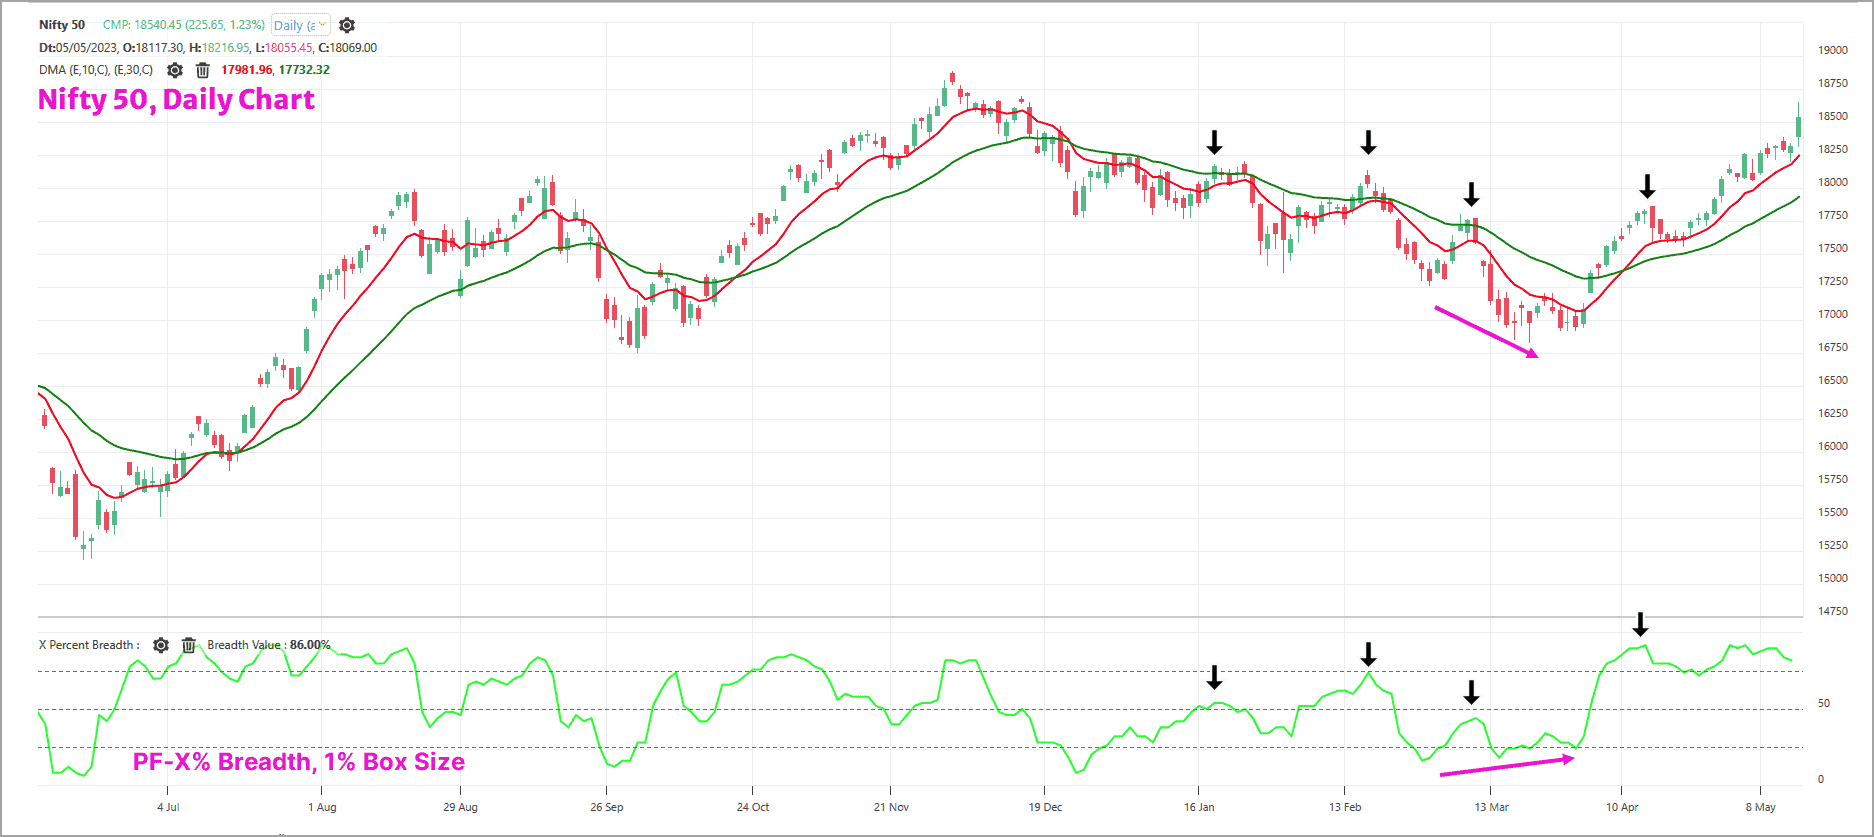
Something different played out since the March lows. The rally off March lows helped the Nifty 50 index snap this bearish sequence of lower highs and lower lows, while the breadth also made inroads into the overbought zone. This is a classic sign of bullishness.
The short-term target based on the vertical count methodology works out to 18,700-18,750. The next major target for the Nifty 50 index is 19,250-19,300. To sum up, the short-term trend remains bullish, and the expectation is that the index would scale higher levels.
The red flags
While the short-term outlook is bullish, there are a few red flags that need to be watched. The first sign of caution is the short-term breadth turning overbought. As always, we use the PF-X% indicator to assess short-term breadth. This indicator tracks the percentage of stocks in a bullish swing in the Point & Figure chart.
We shall use the PF-X% indicator in 1% box size to study the short-term breadth. This indicator is now at an overbought zone with a reading of 82%. The medium breadth indicator is on the verge of moving into the overbought zone. So, the short-term and medium-term breadth indicators are overbought and suggest caution.
The overbought breadth indicator does not necessarily mean a correction or a reversal of the ongoing trend. It is just a sign to tone down bullishness as the price could soon get into either a time-wise correction or a price-wise correction.
As long as the index sustains above the recent swing low at 17,500, the view of a rally to 18,700 and 19,250 would remain intact. In the meanwhile, it would be interesting to watch how the overbought breadth gets resolved and what impact this cool-off has on the price action.
If the breadth cool off does not trigger a slide in the Nifty 50 below the recent swing low of 17,500, it would be a strong sign of bullishness and could strengthen the case for a rise to 19,250-19,300.
Nifty Bank index
A look at the Nifty Bank Index chart reinforces the bullish view for the Nifty 50 index. As emphasized in several posts, the Nifty Bank index plays a pivotal role in influencing the behaviour of the Nifty 50 index. This is valid both from a technical and fundamental perspective.
In the previous post, we had highlighted that a breakout above 42,100 would be a bullish sign and the bank index could then head to 43,100-43,500. The Nifty Bank index crossed this bullish trigger level and also moved past the target zone.
More importantly, in the recent rally, there is a clear outperformance of the Nifty Bank index in relation to the Nifty 50 index. This outperformance of the Bank index is another important aspect favouring bullish view for the Nifty 50 index. The short-term target for the Nifty Bank index is at 44,500-45,000. This target would be under threat if the index drops below 41,900.
Nifty MidSmall Cap 400 index
The recent rally in the Nifty 50 index has rubbed off positively on broader markets too. The Nifty MidSmall Cap 400 index has seen a sharp recovery off the March lows and there is considerable improvement in the market breadth for this index. This is a healthy sign suggesting that buying interest and bullishness has percolated to the mid and small-cap sectors.
The index has multiple resistances in the 11,500-11,600 range. A breakout above this zone would be a strong bullish signal and could propel the broader markets into a new bull orbit. We will discuss targets and other scenarios once the index moves past 11,600.
Interesting sectors
Among sectoral indices, the Nifty Auto index and the Nifty FMCG index are clear standouts. Both these indices are trading at all-time highs, suggesting bullishness. Besides, these indices are also relative outperformers compared to the Nifty 50 index. It would not be a bad idea to consider exposure in the auto, auto ancillary and FMCG sectors.
To sum up, the outlook for Nifty 50 and Nifty Bank indices is bullish. However, there could be short-term weakness or consolidation owing to overbought breadth. If the indices sustain above the bearish trigger levels, there would be a strong case for a rally to higher targets.


2 thoughts on “Technical outlook: Fresh targets for the Nifty 50”
Good Analysis. Thanks
Thank you
Comments are closed.