The bearish view on the Nifty 50 index shared over the past couple of posts has played out, and the Nifty 50 index hit the target of 16,700-16,900 mentioned earlier. Now, after recording a low of 16,828 on March 20, the index has been on a recovery path. The key question, then, would be – is worst is over for the Nifty 50? As always, we will try to address this question using our favourite charting tools including the breadth indicators.
Nifty 50 – Short-term outlook
Featured below is the daily candlestick chart of the Nifty 50 index.
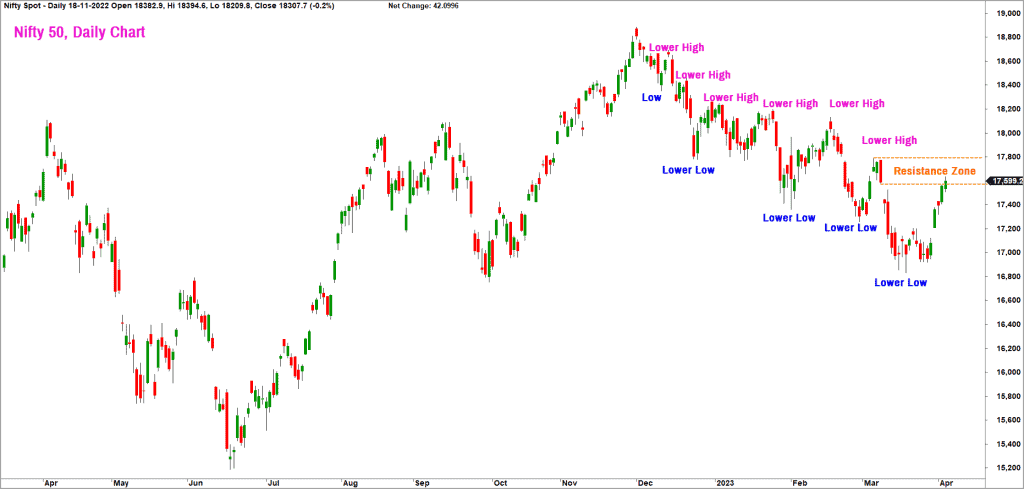
A closer look at the recent price action indicates that the Nifty 50 index has completed a bullish sequence of higher high and higher low. However, the index is yet to register a breakout above the previous swing high at 17,800. A close above 17,850 would be an early signal that the index has completed a significant bottom on March 20. Until then, the recent rally would be considered as a pull-back within an overall downtrend.
The level of 17,850 on the upside and 16,900 on the lower end are the key markers to focus on. A breakout past 17,850 could pave the way for a rally to the 18,350-18,400 zone. From a short-term perspective, the Nifty 50 index is at a crucial resistance. As highlighted in the chart above, the price is at the prior downward gap zone at 17,600-17,800 which is likely to act as resistance.

And a look at the short-term breadth indicator suggests that the breadth has reached an overbought zone. As always, we will use the PF-X% indicator as our breadth indicator. This indicator tracks the percentage of stocks in a bullish swing in the Point & Figure chart.
We shall use the PF-X% indicator in 1% box size to study the short-term breadth. This indicator reached the oversold zone on February 27 & March 14 and the subsequent recovery in the breadth was not strong enough to cross even the 50% mark. More recently, the breadth indicator dropped to the oversold zone on March 28 and this time around, the indicator has managed to go all way into the overbought zone which is a positive sign. The breadth indicator, thus, suggests that the recent rally is more broad-based with participation from most of the stocks.
But the price is yet to cross the previous swing high, and it is currently at a key resistance zone as highlighted earlier. Besides, in the intra-day time frame, the recent rally has pushed the price to an overbought zone, suggesting the possibility of a consolidation or a pull-back.
The breadth indicator along with the price action suggests the possibility of a short-term consolidation or correction in the Nifty 50 index. If the anticipated correction pushes the price below 16,900, it would be a signal that the overall trend is still bearish. We shall discuss fresh downside targets if this level is breached.
On the other hand, if the expected correction sustains above the 16,900 level, there would be a case for further rally in the Nifty 50 index. This would strengthen the case for a rise to the 18,350-18,400 zone. For now, let us await more clues of from the price action rather than trying to second-guess what the Nifty might do.
With the Nifty 50 outlook done, let us look at other market segments and how they stack up from a technical perspective.
Nifty Bank Index
We shall begin with the influential Nifty Bank index. Similar to the price action in the Nifty 50 index, the Nifty Bank index too has completed a bullish sequence of higher high and higher low. However, it is yet to breakout above the prior swing high at 42,100. A move past this level would be a significant sign of strength and would indicate that the low recorded on March 16 is a significant low.
Just as similarly, the Nifty Bank index is also currently at a crucial resistance zone of 41,250-41,800. The recent rally has also pushed the price to an overbought zone in the intra-day time frame. Hence, there is a possibility of a consolidation or correction in price. For the bullish case scenario to play out, the Nifty Bank index has to sustain above 39,100.
A move past 42,100 would be a sign of strength and could open up the possibility of a rise to 43,100-43,500. For now, we have to await further clues from the price action to decipher what is in store.
While there are a lot of similarities in the price action of the Nifty 50 and Nifty Bank, the recent rally in the bank index has not been strong enough to register a breakout in the ratio chart. Have a look at the ratio chart of Nifty Bank index and Nifty 50 index which captures the relative performance of the Nifty Bank index versus the Nifty 50 index.
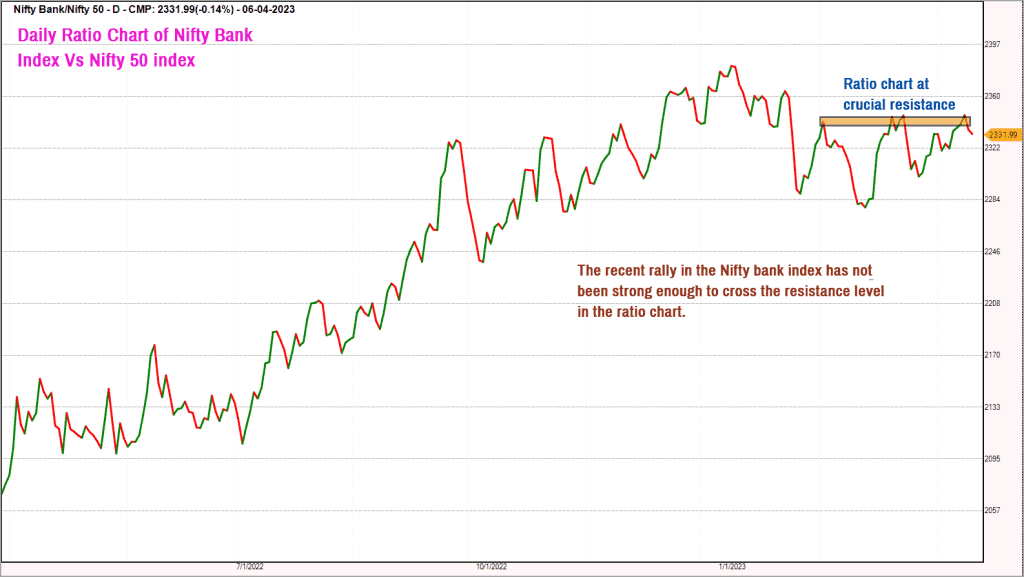
As highlighted in the above chart, the Bank index is yet to struggling to clear the key resistance zone. It is essential that there is a breakout in the ratio chart which would indicate outperformance of the banking sector. It is essential from a technical and fundamental perspective that the banking sector takes the lead role in propelling the Nifty 50 index to higher levels. Keep an eye on this ratio chart to assess the relative performance of the banking stocks.
Nifty MidSmall Cap 400 index
While the Nifty 50 index has seen a sharp pull-back rally, the broader markets are yet to share a similar enthusiasm. The Nifty MidSmall Cap 400 index continues to underperform the Nifty 50 index indicating that the buying interest is yet to percolate into the broader markets. A look at the short-term breadth indicator for the broader markets indicates a similar picture of relative underperformance.
It would therefore make sense to wait for conclusive evidence of outperformance before increasing exposure in the broader market segment.
To summarise, the two major indices – the Nifty 50 & Nifty Bank are at crucial resistance level and are in the overbought zone both in terms of price and breadth. This scenario is conducive to trigger a short-term consolidation or correction. How far the price drops in this anticipated correction holds the key to short-term directional move.
If the rally sustains in the Nifty 50 index, the Nifty FMCG index and the Nifty CPSE would be the sectors to focus on. The capital goods stocks too are displaying promise. As far as the broader markets are concerned, I would prefer to wait for more evidence to indicate sustained outperformance.
As always, we shall keep you updated!


1 thought on “Technical outlook – Is the worst over for the Nifty 50?”
Thanks for the detailed review.
One Request, As gold is nearing all time high, any views on Gold from India perspective.
Thanks again 🙂
Comments are closed.