We have been giving the outlook for the Nifty 50 over the past several months. With the market movements, there is no significant change that we can see from the stance explained in the earlier outlooks. Therefore, now, we turn our focus on two interesting sectors apart from the Nifty 50 – one that’s on the cusp of a recovery and the other.
Nifty 50: status quo
In our previous update, we had indicated that there was a case for a short-term rally extending up to 16,900-16,950. As anticipated, the Nifty 50 index recovered ground and was close to hitting this target. After recording a high of 16,793 on June 3, the index turned weak and has since been in a downtrend.
There is no change to the long-term outlook for the Nifty 50 index. We still maintain that a retest or a breach of the March 2022 low of 15,670 is likely. We will issue a detailed note on the Nifty 50 index later. For now, our earlier calls stand.
Instead, let us focus on a couple of sectoral indices – the Nifty Auto Index and the Nifty Bank Index.
Nifty Auto: moving to outperformance
This sector is setting up well. Before we study the price chart of the Nifty Auto Index, let us look at the weekly ratio chart of the Nifty Auto Index versus the Nifty 50 index. The ratio chart will help understand the relative performance of the index against the Nifty 50 index. Here is the ratio chart plotted in the weekly time frame.
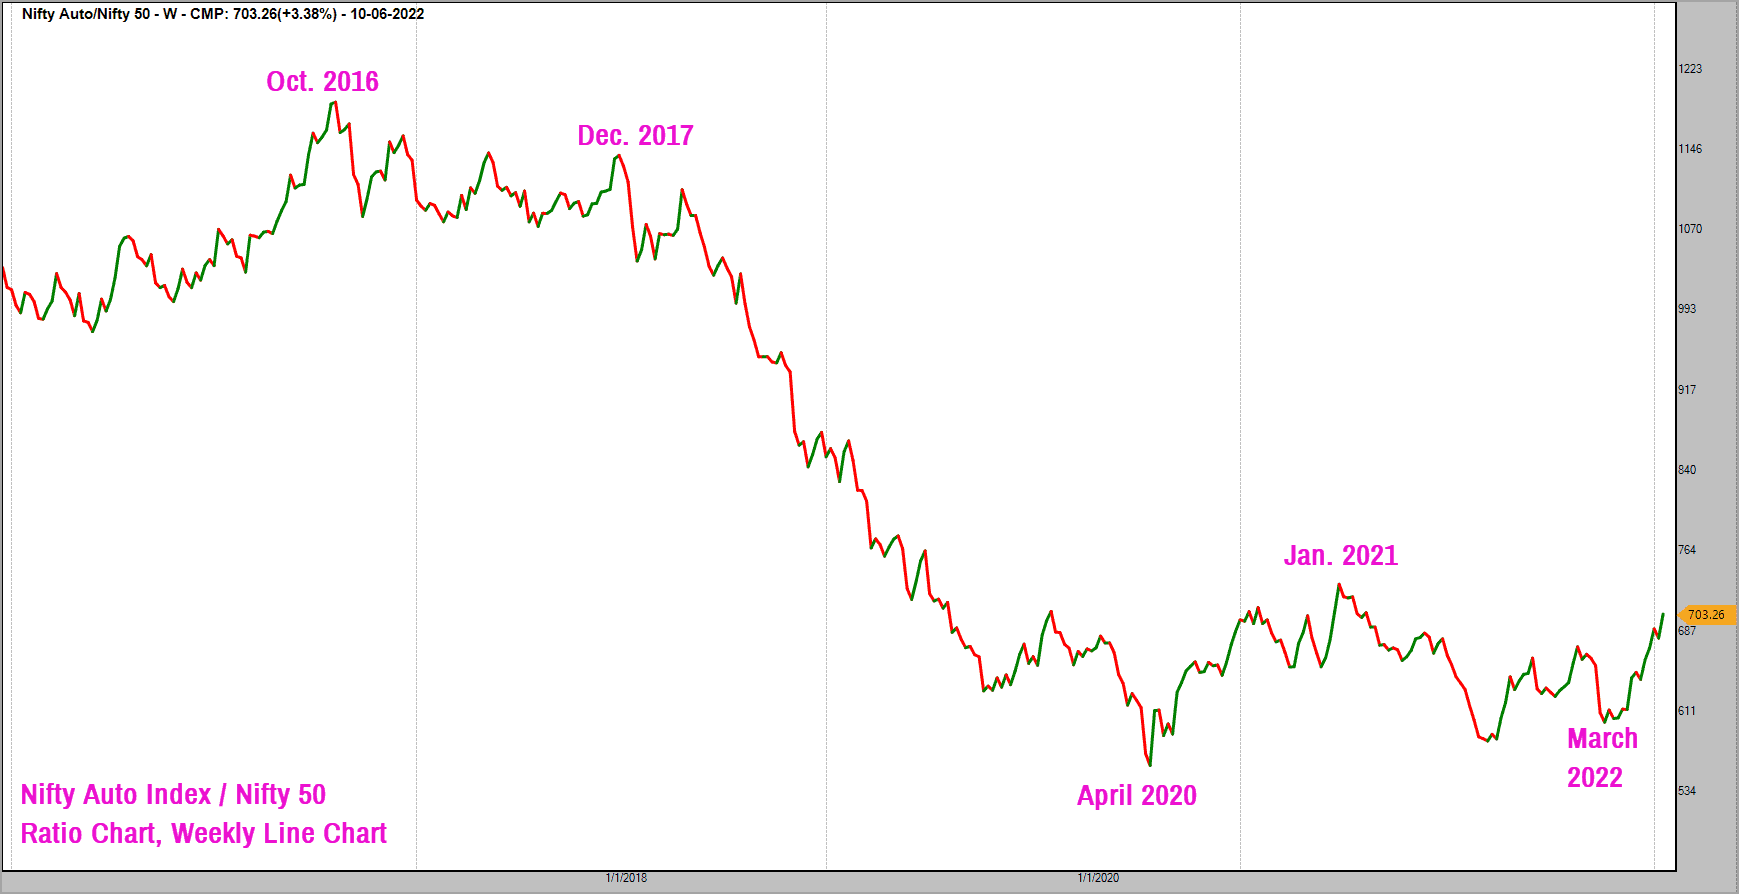
The trend in the above chart was bearish since October 2016, indicating that the Nifty Auto Index was underperforming the Nifty 50 index. The underperformance continued until April 2020 after which the performance of the Auto index was broadly at par with the Nifty 50 index.
More recently, there are signs of relative outperformance of the auto index. In the chart above, there is a strong recovery that is visible since March 2022, indicating outperformance of Nifty Auto index.
I would prefer to see this ratio chart move above the January 2021 high, which is the upper end of the current trading range. A move past this high would indicate a breakout from the recent consolidation and would make a more compelling case for taking a closer look at the Auto sector.
For now, it is advisable to wait for a few weeks to get that confirmation in the form of a breakout above January 2021 highs. Let us also take a look at the price chart of the Nifty Auto index to understand the trend and the near-term prospects.
Here is the Nifty Auto Index Renko chart plotted using the 3% brick. This chart captures the long-term trend of the index.
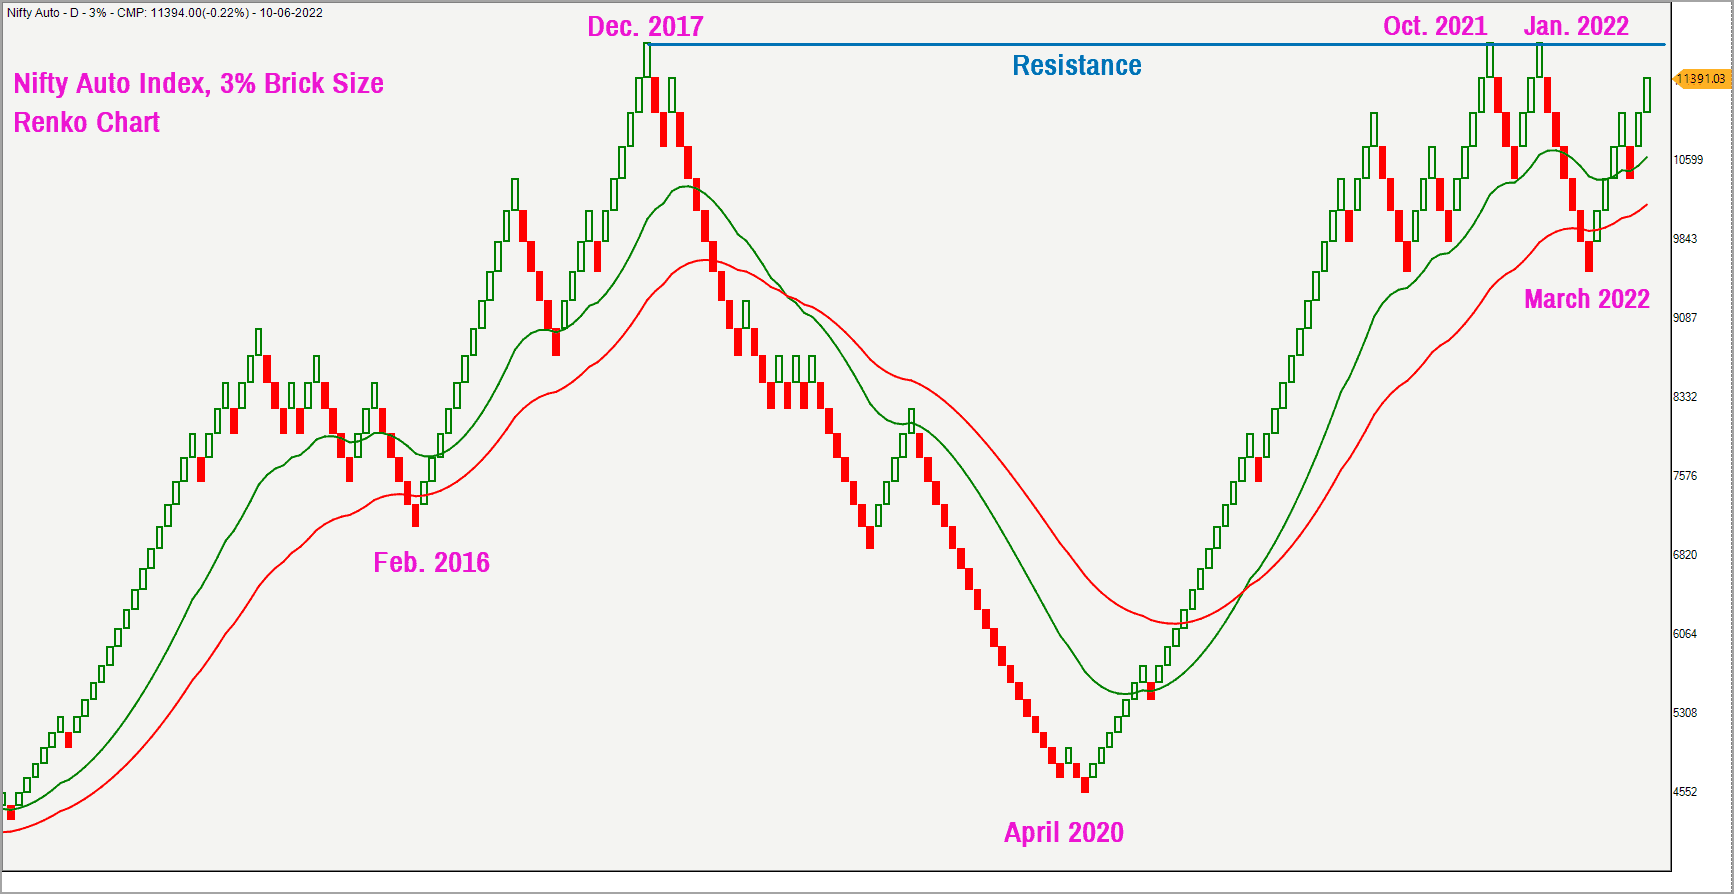
Along with the Nifty 50 index, the Nifty Auto index too hit a peak in October 2021 and both indices witnessed a correction thereafter. However, what is interesting about the Auto index is that it is currently trading pretty close to the all-time highs recorded in October 2021 which is at odds with the Nifty 50. The Auto index is just 6.1% lower from this high whereas Nifty 50 index is almost 13% down from its highs. That the Auto index is positioned close to its all-time highs is a bullish sign in itself. The moving averages in the above chart are positively aligned with the short-term moving average positioned above the long-term moving average.
The other interesting aspect is that the index has pulled back to the moving average and has bounced off the long-term moving average. This pull back and recovery has addressed the overbought condition that was prevalent earlier. So, the index is not overbought in the long-term and it is within the striking distance of its all-time highs, making it an interesting candidate to focus on.
A close above 12,100 would not only complete a breakout above the multiple resistance highlighted in the above chart but would also push the index to fresh life-time highs.
Keep an eye on the 12,100 level in the Nifty Auto Index and also watch the weekly ratio chart of the index versus Nifty 50. As mentioned above, a break above January 2021 highs in the ratio chart along with a move past 12,100 in the price chart would be the ideal combination to step up exposure in this sector.
Nifty Bank: wait it out
The bank sector is always an interesting one to take up given the influence it wields over the Nifty 50 and the heavy share it has in the listed space in general. As always, let us start with the ratio chart of the Nifty Bank index versus the Nifty 50 index. Here is the weekly ratio chart of these two indices.
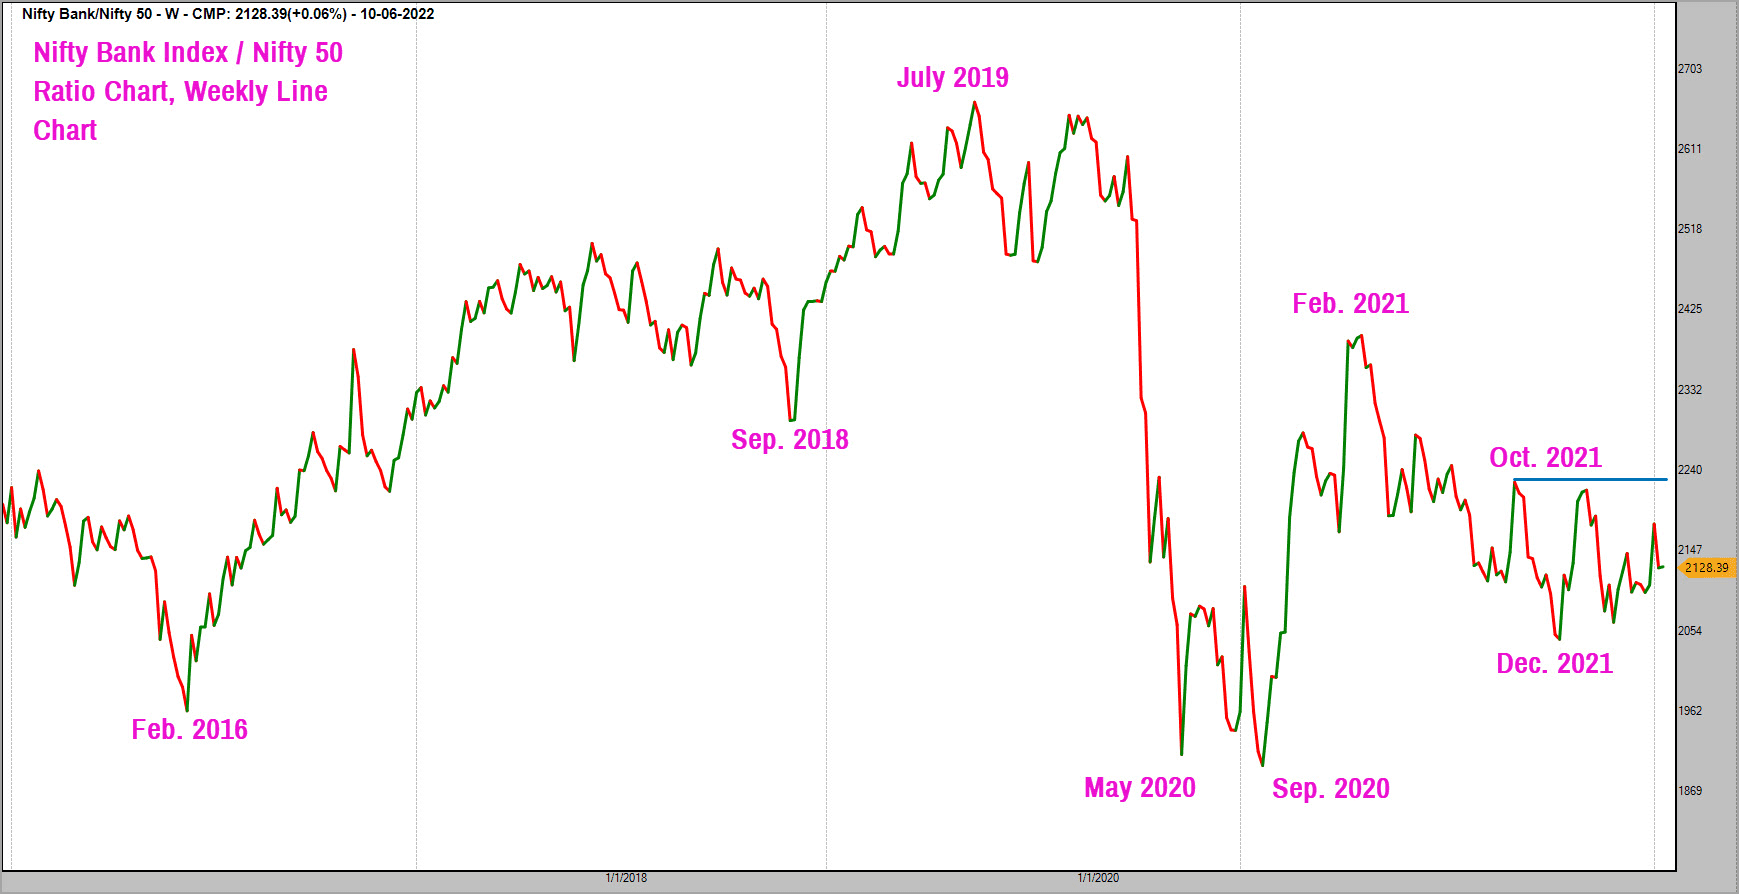
It is clear from the above chart that the Nifty Bank index has underperformed Nifty 50 during the period from July 2019 to September 2020. After a brief bout of outperformance until February 2021, the Nifty Bank index had broadly underperformed the Nifty 50 index until December 2021. The performance since then has been at par.
But the ratio chart has to move past the resistance at October 2021 high to indicate a strong outperformance. Until then, therefore, it would be advisable to keep exposure on the lighter side in the banking sector.
Let us also take a quick look at the chart of the Nifty Bank index to gather more information about the price trend. Here is the weekly chart of the Nifty Bank index.
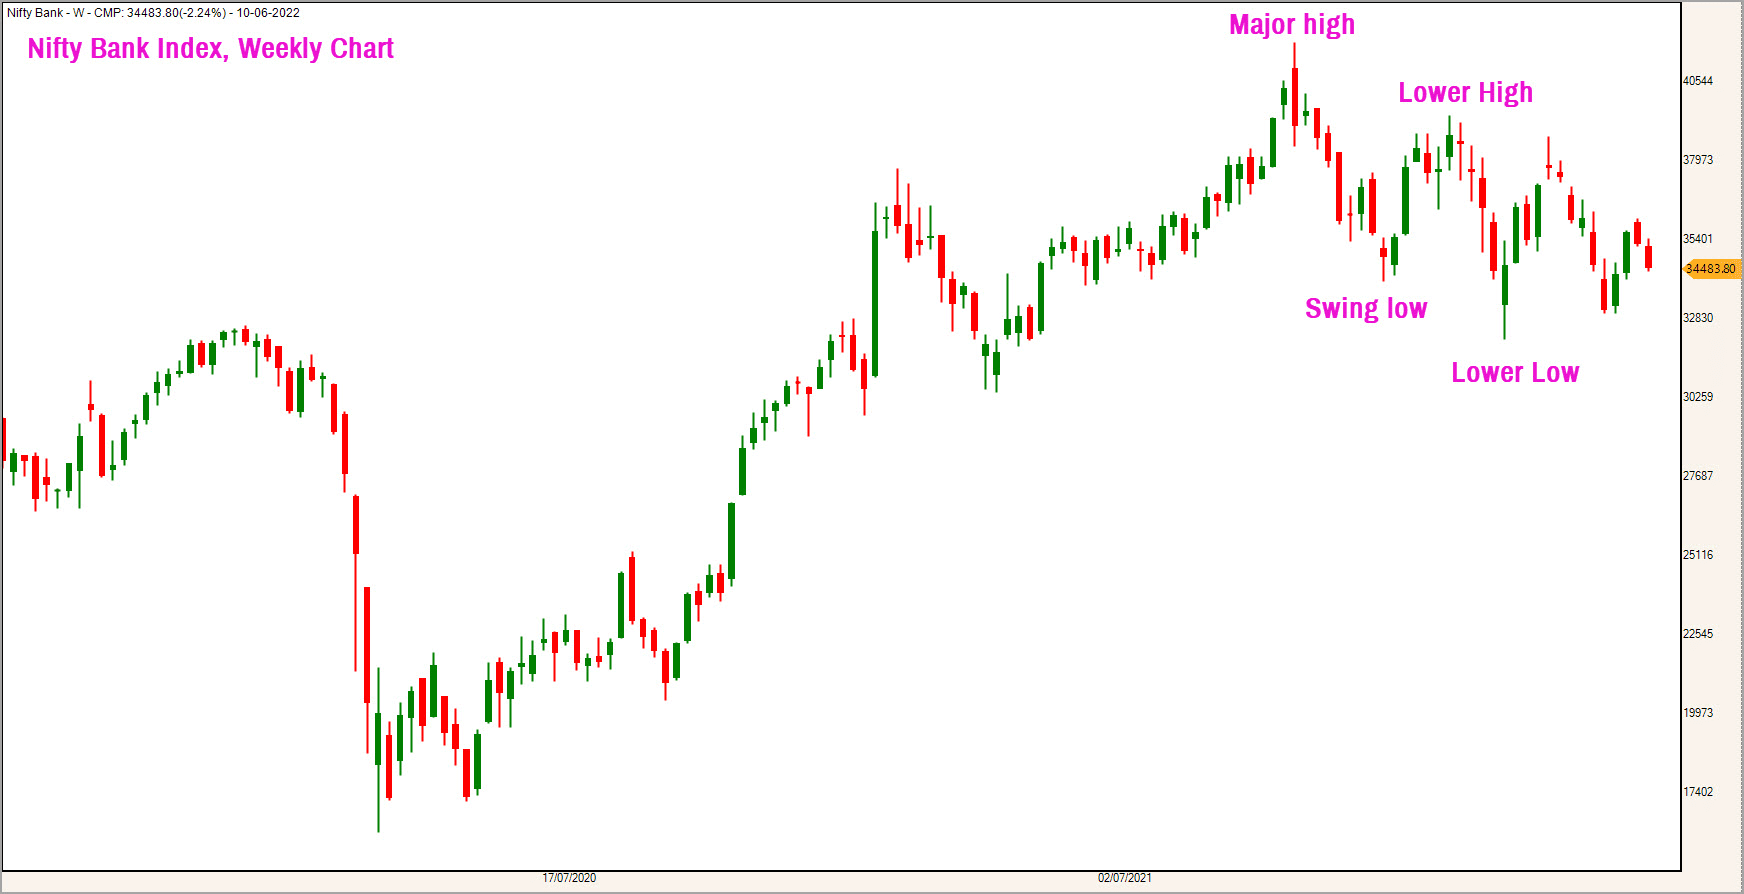
As highlighted in the above chart, the price is tracing out a bearish sequence of lower highs and lower lows. Only a move past 39,450 would invalidate this bearish sequence and result in the start of a bullish sequence of higher highs and higher lows.
To summarise, the ratio chart is still not indicative of outperformance of the bank index and the bearish structure in the price chart is not of any comfort either. A move past 39,450 and a breakout above the October 2021 high in the weekly ratio chart are the prerequisites before I get interested in the banking sector. Hence, keep a tab on this sector and await a clear breakout in the ratio chart and the price chart before committing fresh exposure to the banking sector.