In our last article, we discussed the performance of sectoral indices. A look at the thematic and strategy indices on the National Stock Exchange (NSE) would be a logical follow-up to the previous post.
We will be using the same Point & Figure charting based methodology, that was used earlier, to identify the outperformers in relation to the Nifty 50 index.
The objective of this article is to address:
- Which are the indices that are outperforming the Nifty 50 index?
- What is the technical outlook for these indices?
- What is the upside potential and trend invalidation for these indices?

Let us begin with the Relative Strength Matrix scores which is generated across four different box sizes in the Point & Figure chart. These four box-sizes capture the trend in the ratio chart or the relative strength chart across multiple time frames. The benchmark for this study is the Nifty 50 index.
Here is the Relative Strength ranking table. The sectoral indices are not included, and the focus is on the outperformers from the thematic and strategy indices offered by NSE.
If you notice, the Nifty SMALL CAP 50 index or the Nifty small cap 50 index is at the top, suggesting that this index is the top outperformer in relation to the Nifty 50 index. Here is the ratio chart of Nifty SMALL CAP 50 index versus Nifty 50 in the Point & Figure format.
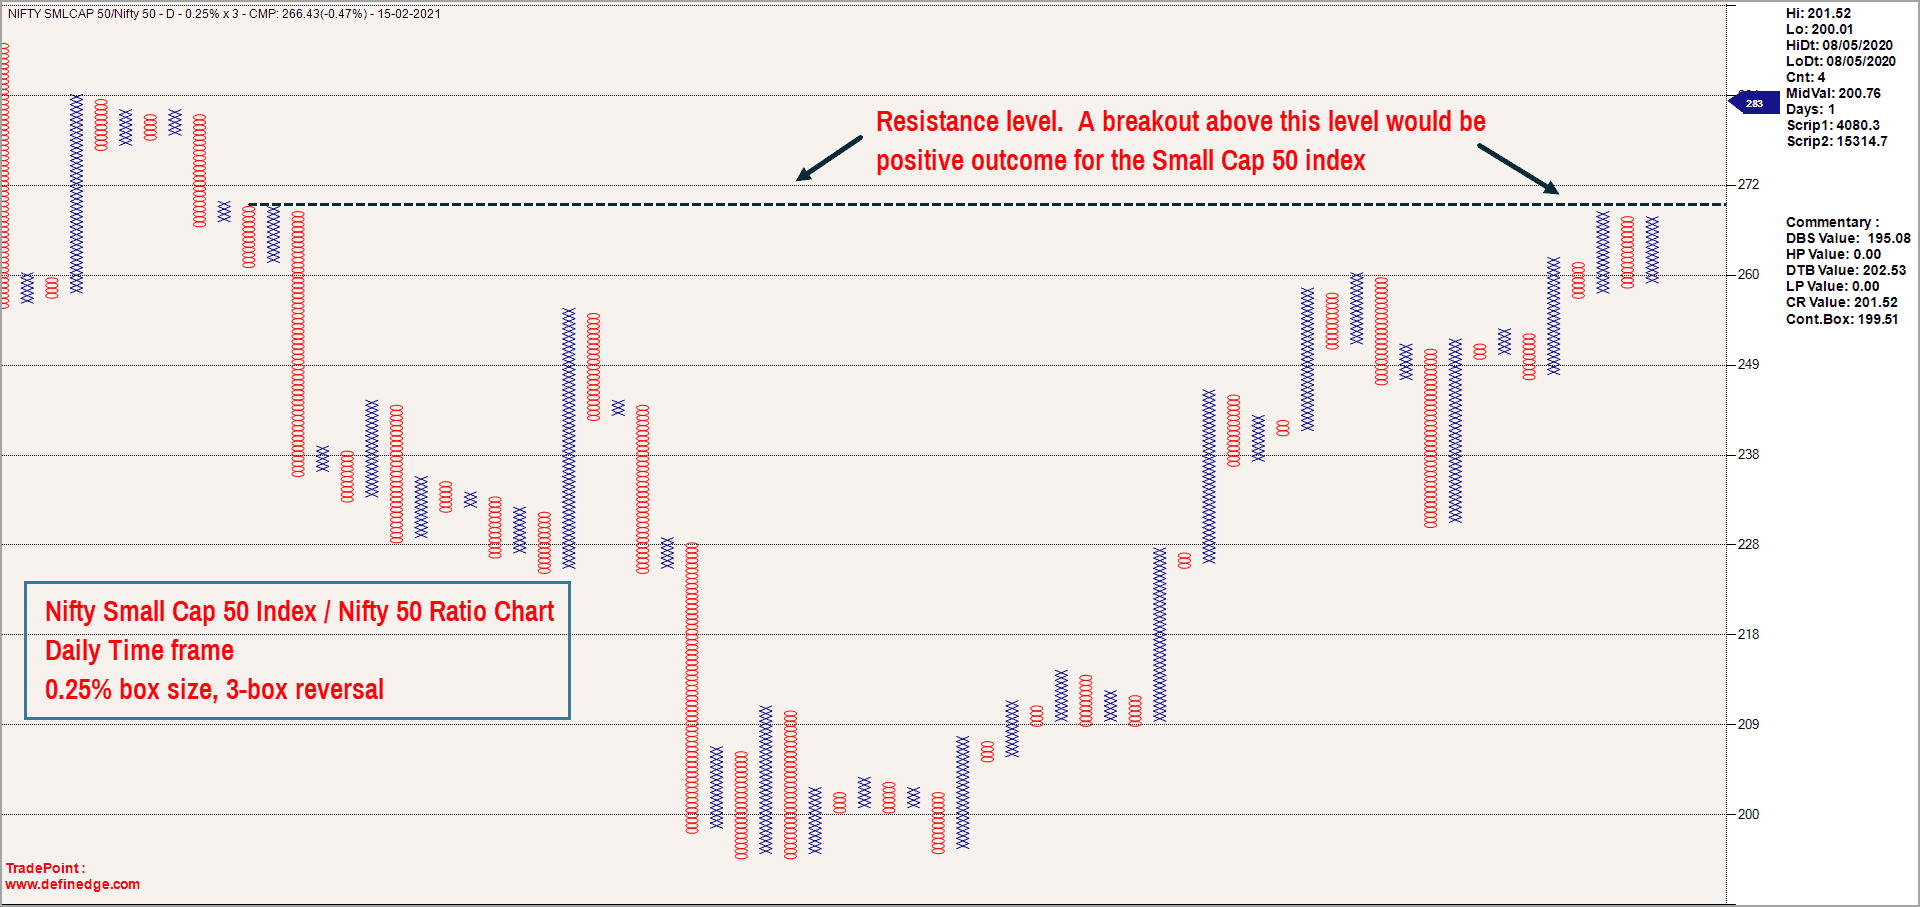
The Nifty SMALL CAP 50 index has been in an uptrend since May 2020. There was a bit of a ranging price action evident in March – April 2020 suggesting on-par performance. The subsequent uptrend since May suggests that the Nifty SMALL CAP 50 has been outperforming Nifty 50 index.
The ratio chart is at a crucial resistance level and a breakout here would impart momentum to the Nifty SMALL CAP 50 out performance. Let us also take a quick look at the price chart of the Nifty SMALL CAP 50 to understand the technical picture and outlook.
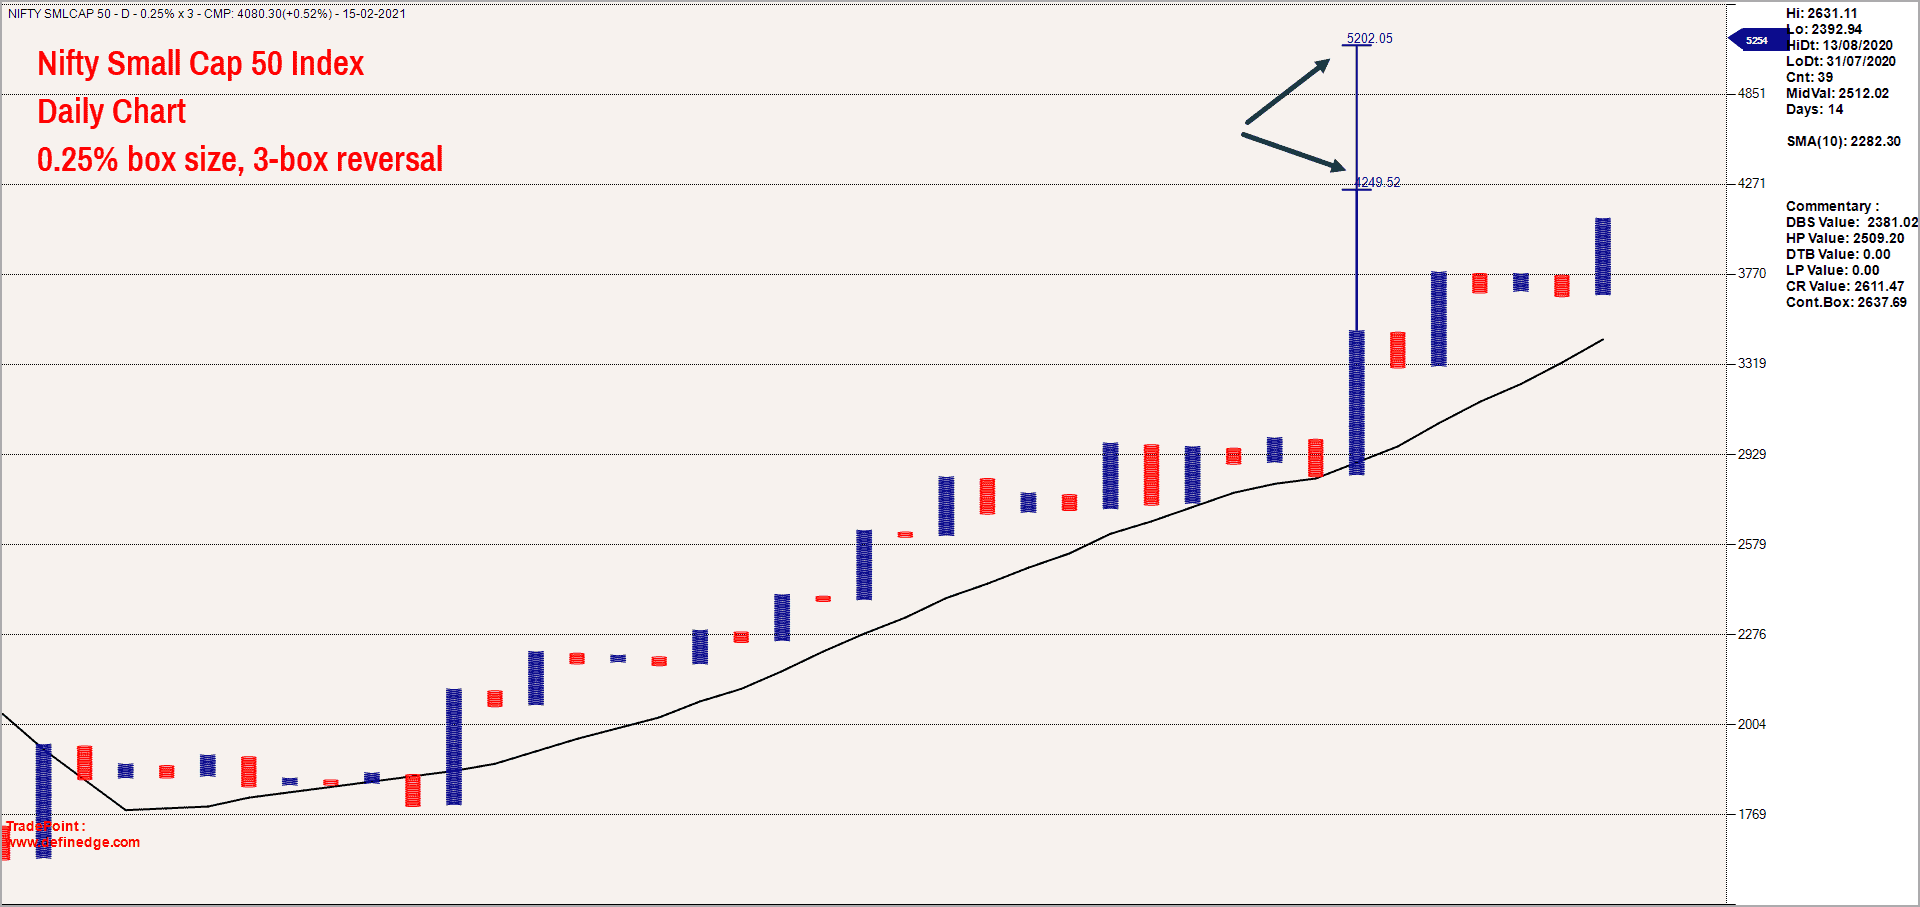
The price is in a strong uptrend and there is an open upside targets of 4,250 & 5,200. The second target of 5,205 is slightly long-term oriented and would take a few months or even years to achieve. These targets would be invalidated if the index falls below 3,300.
Here is the list of index heavyweights from the Nifty SMALL CAP 50 index for a quick reference. (Source www.nseindices.com)
The Nifty Midcap Liquid 15 is another outperformer in relation to the Nifty 50 index. Here is the chart of this index in the Point & Figure format.
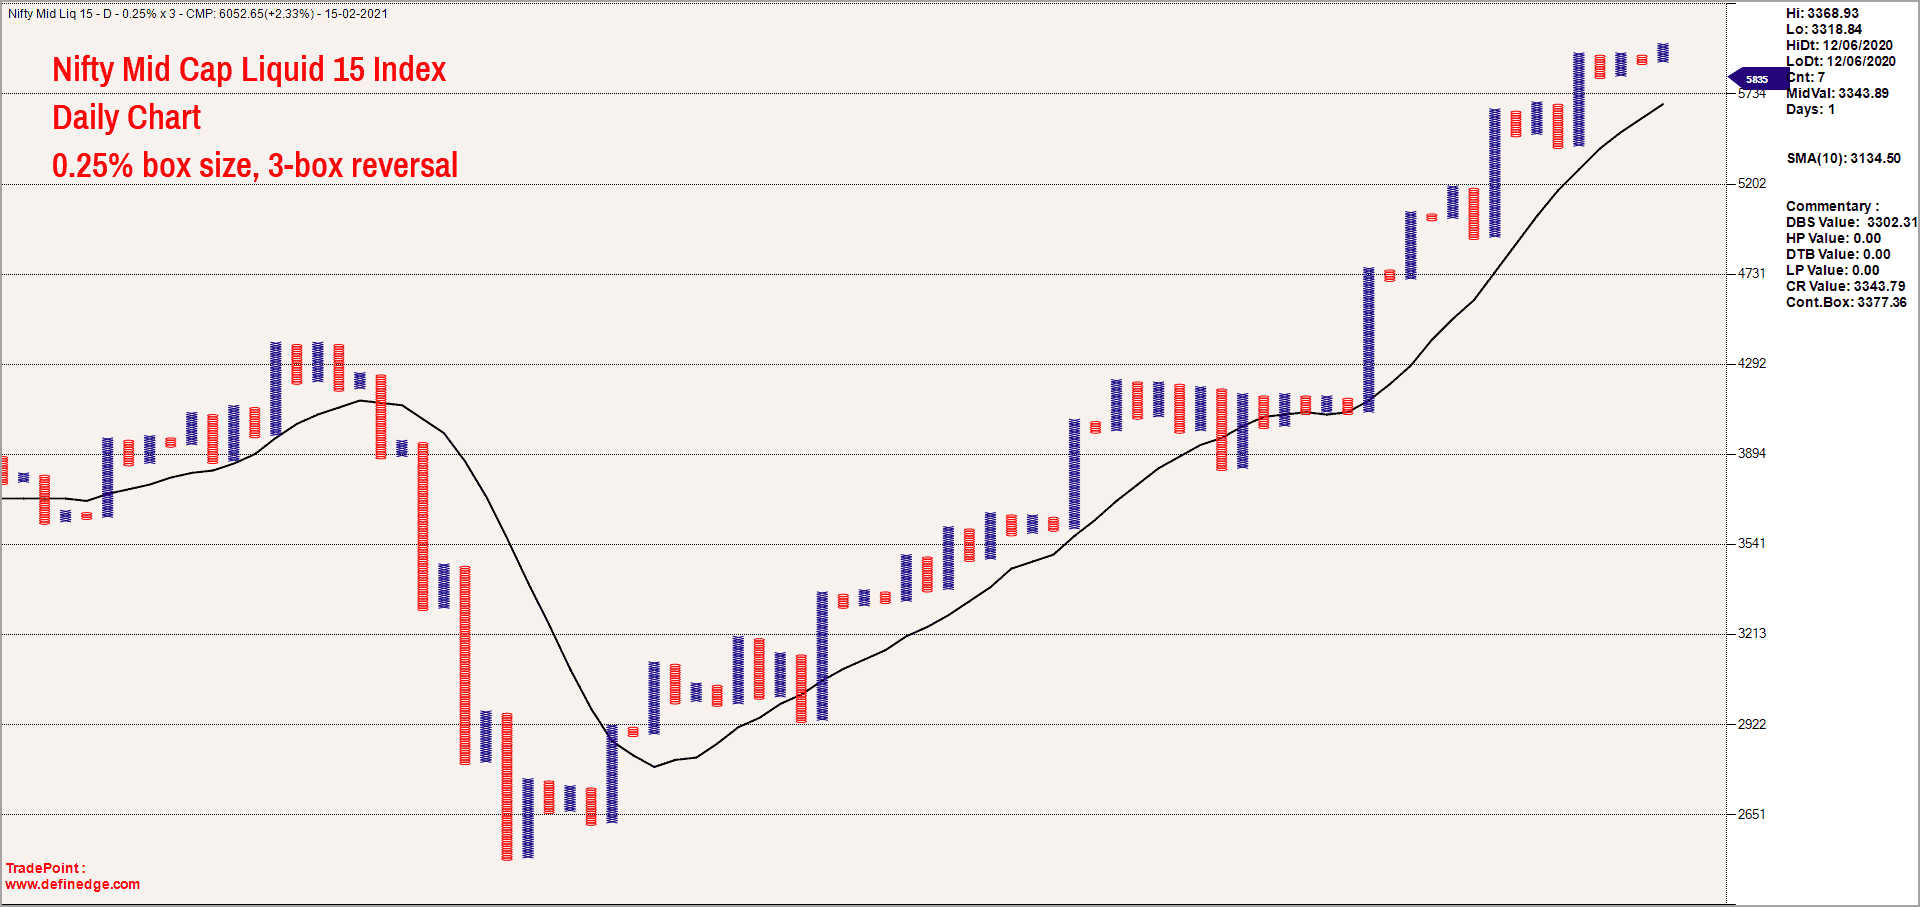
The price is at an life-time high and the undertone is bullish. There are open upside targets of 6,480 and 7,280. The second target of 7,280 again is relevant from a medium to long term perspective and it may take several months to years to achieve this target. A fall below 4,850 would invalidate the positive outlook for Nifty Midcap Liquid 15 index.
Here is the table that captures the top 10 heavyweights of Nifty Midcap Liquid 15 index.
The Nifty Mid Cap 50 index is another index which is among the top outperformers versus the Nifty 50. Let us take a quick look at this index too. Here is the Point & Figure chart of the index with relevant targets.
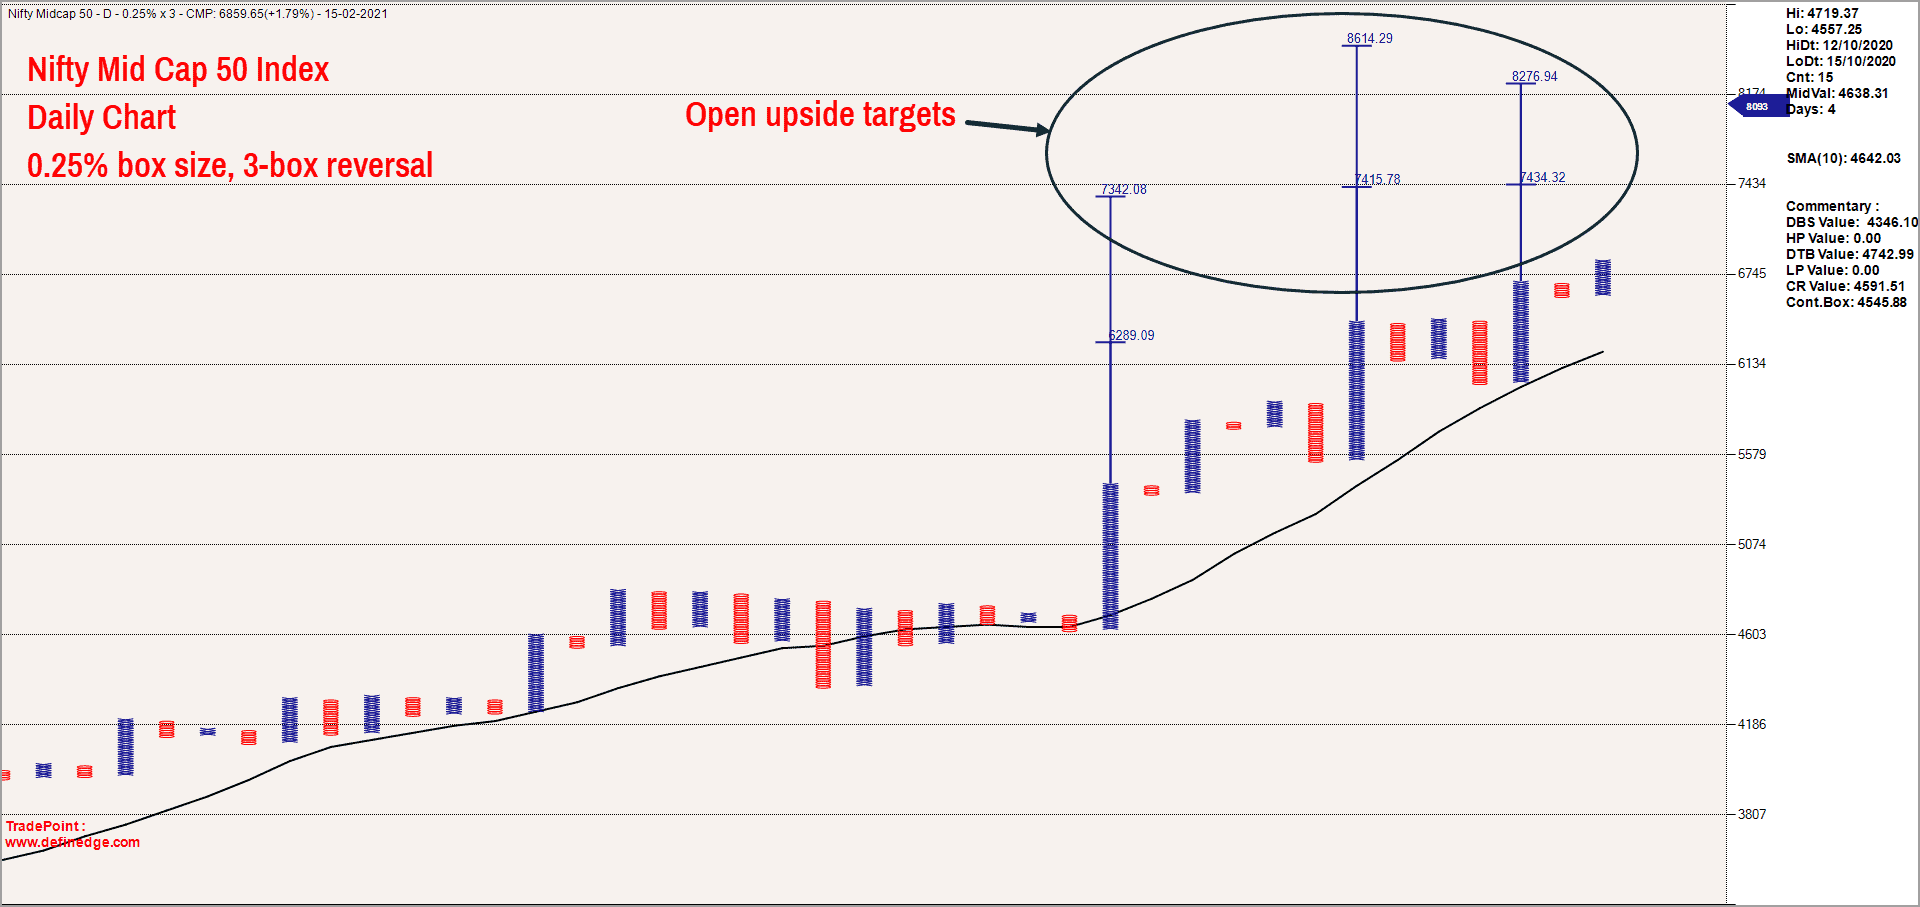
This index too is at life-time highs and the trend is bullish. The short-term targets are 7,340-7,420 while the medium-term targets are 8,200-8,600. The positive outlook for Nifty Mid Cap 50 index would be under threat if the price falls below 5,800.
Here are the top 10 stocks having maximum weightage in the Nifty Mid Cap 50 index.

Also Read : Nifty Analysis on 7th March 2021


20 thoughts on “Outlook on indices that are outperforming Nifty 50”
Sir, Although relative strength ratios led to Nifty Fin sector as the outperformer in the begining of Feb, it is Metals that are in the outperformance now and ratio is at all time highs. Banks and Fin did do well in the first week and second, but has been lagging.
Allocation to Fin in the face of analysis of ratios raises a question.
How do you see this disparaging outcome? Do you see this lagging as
Hello:
The analysis and conclusion is based on the then prevailing price action. Obviously, opinion and the sectors to focus on, would change based on fresh inputs based on the fresh price action. The choice of time frame to do the analysis matters.
If you want inputs for medium to long term trends then you have to look at the relevant time frame charts. If someone is looking at long term trends in outperformance, the short-term underperformance would not matter. But we share inputs for short term (ranging from few weeks to few months at best). Hence the short-term analysis done about a month ago might not be relevant now and of course the current scores have to be studied to get fresh ranking.
Hope this helps.
B.Krishnakumar
Sir, Thanks for your reply.
The takeaways from your write up as on Jan 25th data are as follows:
— Focus on the common sectors that figure at the top of both tables to identify strong outperformers.
–Sectors such as Nifty Auto, IT and Nifty Bank fall in this category. Focus on these sectors in the short-term (8-12 weeks). But to do this, wait until Nifty 50 shows signs of uptrend.
Clearly, ratio charts led to Auto, IT and Bank as focus areas for 8-12 weeks. But that hasn’t been the case. They have not been the stand outs.
Pointing that time frame that you wrote on Jan 25th and the question posed in this article are still valid.
8-12 weeks from Jan 25th gives room for end of March to end of April.
Hope this helps to respond.
Hello:
You are spot on. The analysis and the interpretation was based on the data available as on the article publication date. The analysis is based on the premise that the conditions that then existed, would persist. If not, the view would change. And, Auto, IT and banks did perform well after the publication of that post. These sectors are taking a breather now. As mentioned, let us assess the position after 8-12 weeks. May be this trio does well, may be not.
If the performance of metals improve and rises to the top, we would acknowledge the same. It is impossible for anyone to predict inflection points in trends. The analysis is always done with the assumption that the broad trends would persist.
Hope this helps. And of course, my analysis can go wrong. I do not claim a track record of 100% accuracy. That is impossible for anyone dealing with the market. We deal with probabilities here. As long as I am right more often than not, I would be happy. And, that is good enough to generate decent returns.
Regards
B.Krishnakumar
To sum up, things can go wrong in any analysis. That is where risk management comes into play. We also share the methodology here. The idea being those interested can use the methodology to get updated picture based on latest price action.
Regards
Though I am member of Prime Investor and paid the fees of Rs 5900.on 28th Jan but still can’t see any article. Is it a plain cheating or something else.
Sir, the account that you have registered with is under this email ID : [email protected].
Please use that email to access your account.
I would like to see a comprehensive analysis of all the indices with their rolling returns and risk adjusted returns over a time frame of 1,3,5 and 10 year periods along with suitable ETFs best mirroring these indices. I have been searching for a comprehensive article on the subject in Prime Investor. Please let me know if such an analysis has already been done and the relevant link may be sent to me.
If such an analysis has not been done, I would urge you to take it up.
Regards,
Venkatesh
The output of such an analysis in the PRime ETF list. We do not have a tool for you to do it yourself, currently. Vidya
Please explain the scores in the column heading in the table for Relative strength matrix with Nifty 50 as benchmark.
Haven’t understood 0.25% 1% 2% 3% Total Score
Thanks,
Prakash
It is explained in the previous article and link provided in this article in the beginning. https://primeinvestor.in/point-figure-charts-winners-in-sector-performance/ thanks, Vidya
Hello Primeinvestor team,
What recommendation is there for an investor to use the MF or ETF route based on this research report.
Thanks
Madhavan
Hello Madhavan:
We will look into this aspect and come up with some solutions for the same.
Regards
B.Krishnakumar
Hi
Under the Nifty small cap constituents, I observe a typo “EDFC” , bringing it to your notice
Thank you sir. We will correct it. Vidya
Good insight Krishna !! But how to play these as no defined Index/ETF are there to invest as a basket nor had any recommendations from the list of stocks published in this article?
Hello Shakir:
We shall keep this in mind and include some solutions for these issues in upcoming posts.
Regards
B.Krishnakumar
Thanks for the detailed analysis. Helpful.
One suggestion: Add one last para on: what actions can be planned by investors based on this analysis. And what type of investors. And typically how much. Of course, you can only give a broad guideline!
Hello:
The view and the outlook posted by me is typically valid for the next few months (6 months to a year). We will come up with a follow-up article if the prior view warrants a change.
Regarding actions that can be taken, please consult your financial advisor and /or the recommendations given by Primeinvestor regarding the relevant funds. Hope this helps.
Regards
B.Krishnakumar
The analysis is good.
I am having a doubt.
Now that most of the stocks in mid cap 50, liquid 15 and small cap 50
are at their highs, in future say during next 6 months to one year,
the appreciation in these stocks and also in other stocks would at best be minimal and further steep rise May pause for 6 months to one year.
Please share your thoughts on this view.
Sudhakarudu
Hello Sudhakarudu:
It is a common misconception that a stock that is trading at life-time highs is dangerous to be bought. The normal thought process is, the stock has run up too much or so much, is there scope for further rise. Think about this. Check any stock that has become a multi bagger. It has to cross its life-time highs first and then keep marching higher. So, let us not get bothered by buying stocks at highs. There is always a trade off in whatever decision we take. Hence, it is prudent to have a well defined exit plan for any investment decision taken.
Once the exit plan is clear, the risk would be defined too. And, once the risk is defined, then decision making becomes more stress free. Hope this helps.
Regards
B.Krishnakumar
Comments are closed.