
This is an update to the Nifty outlook that was posted on January 9 2021. The Nifty 50 index has achieved the first upward target of 14,600 that was mentioned in the earlier post. And the index also got within striking distance of the second target of 15,900. The Nifty 50 index registered a high of 15,371 before the recent slide.

Current market observations
Given that the Nifty has stepped back from these highs, what’s the current position of the index? Let’s take stock of a few technical metrics. In the Renko chart over a bigger time frame (3% brick size chart), the disparity index is at elevated levels, suggesting overbought conditions. The disparity index measures the distance between the moving average and the current market price. The gap is expressed in percentage terms.
Have a look at the chart featured below.
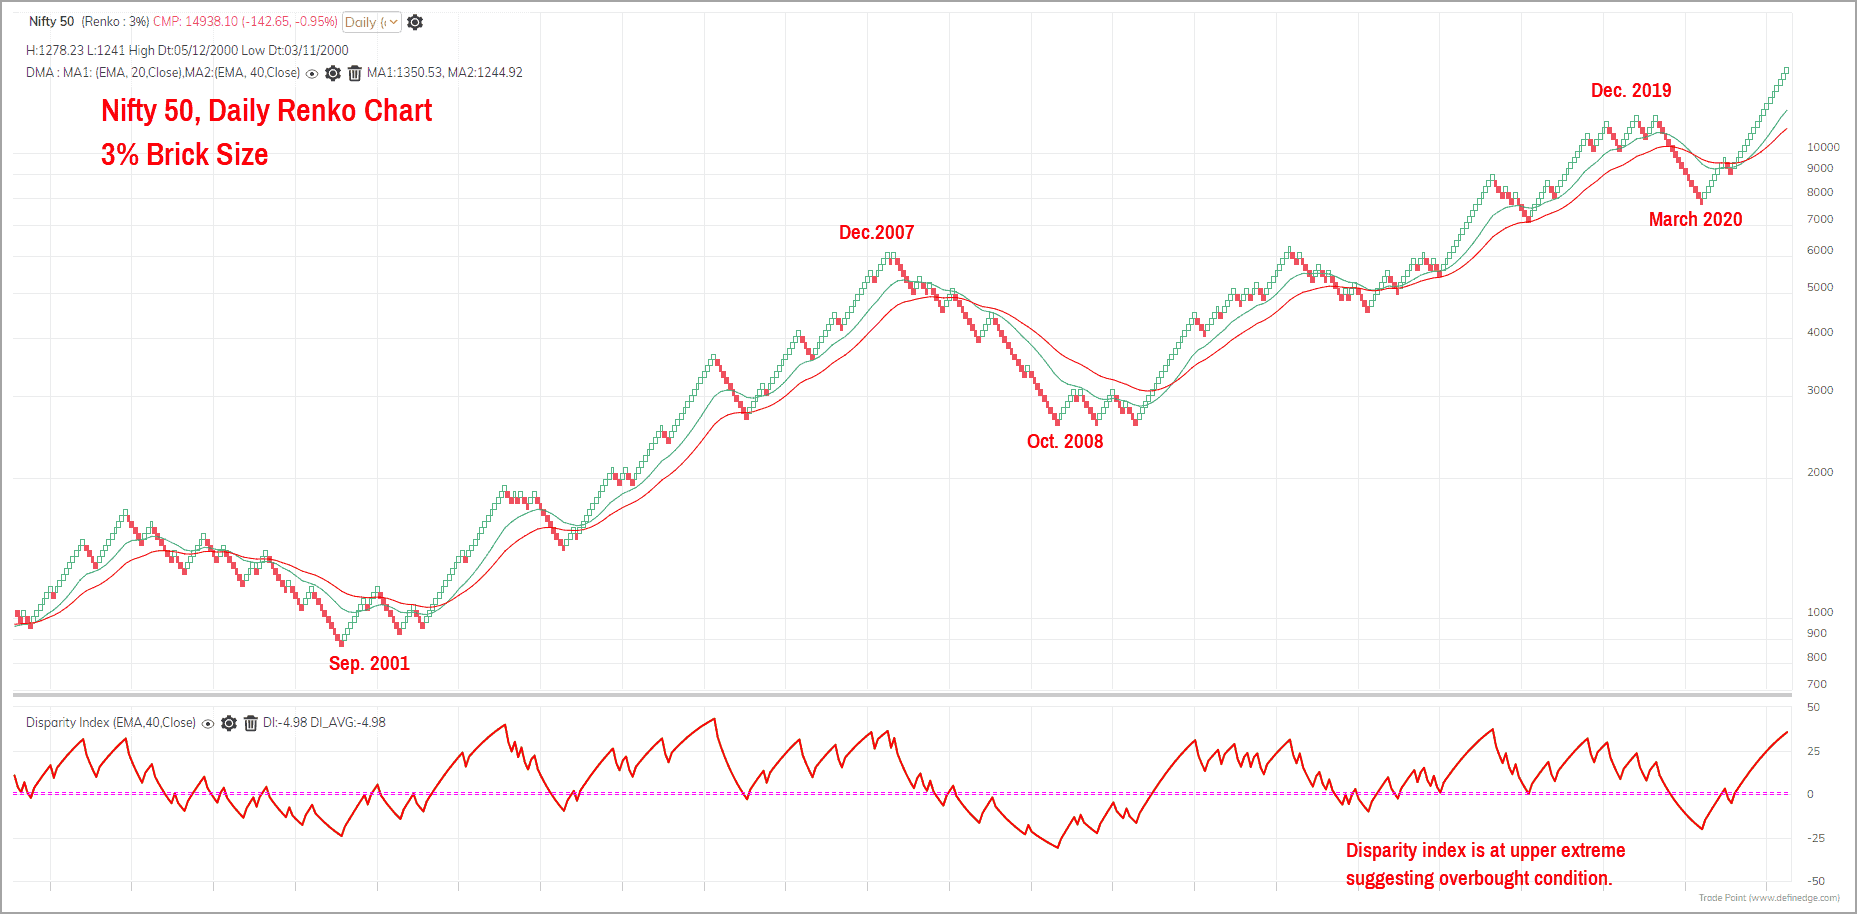
The disparity index is now at levels where the Nifty 50 index has historically cooled off. Hence, there is a case for a correction to happen in Nifty 50 index that would help the disparity index decline. But there is no point pre-empting or second guessing the timing of this fall. It pays to be cautious, but it does not call for any panic.
Let’s take a look at a slightly shorter time frame to get an idea of what to expect in the near term (next 8-12 weeks). The Renko chart featured below is plotted with a 1% brick size and captures price action over a shorter time frame.
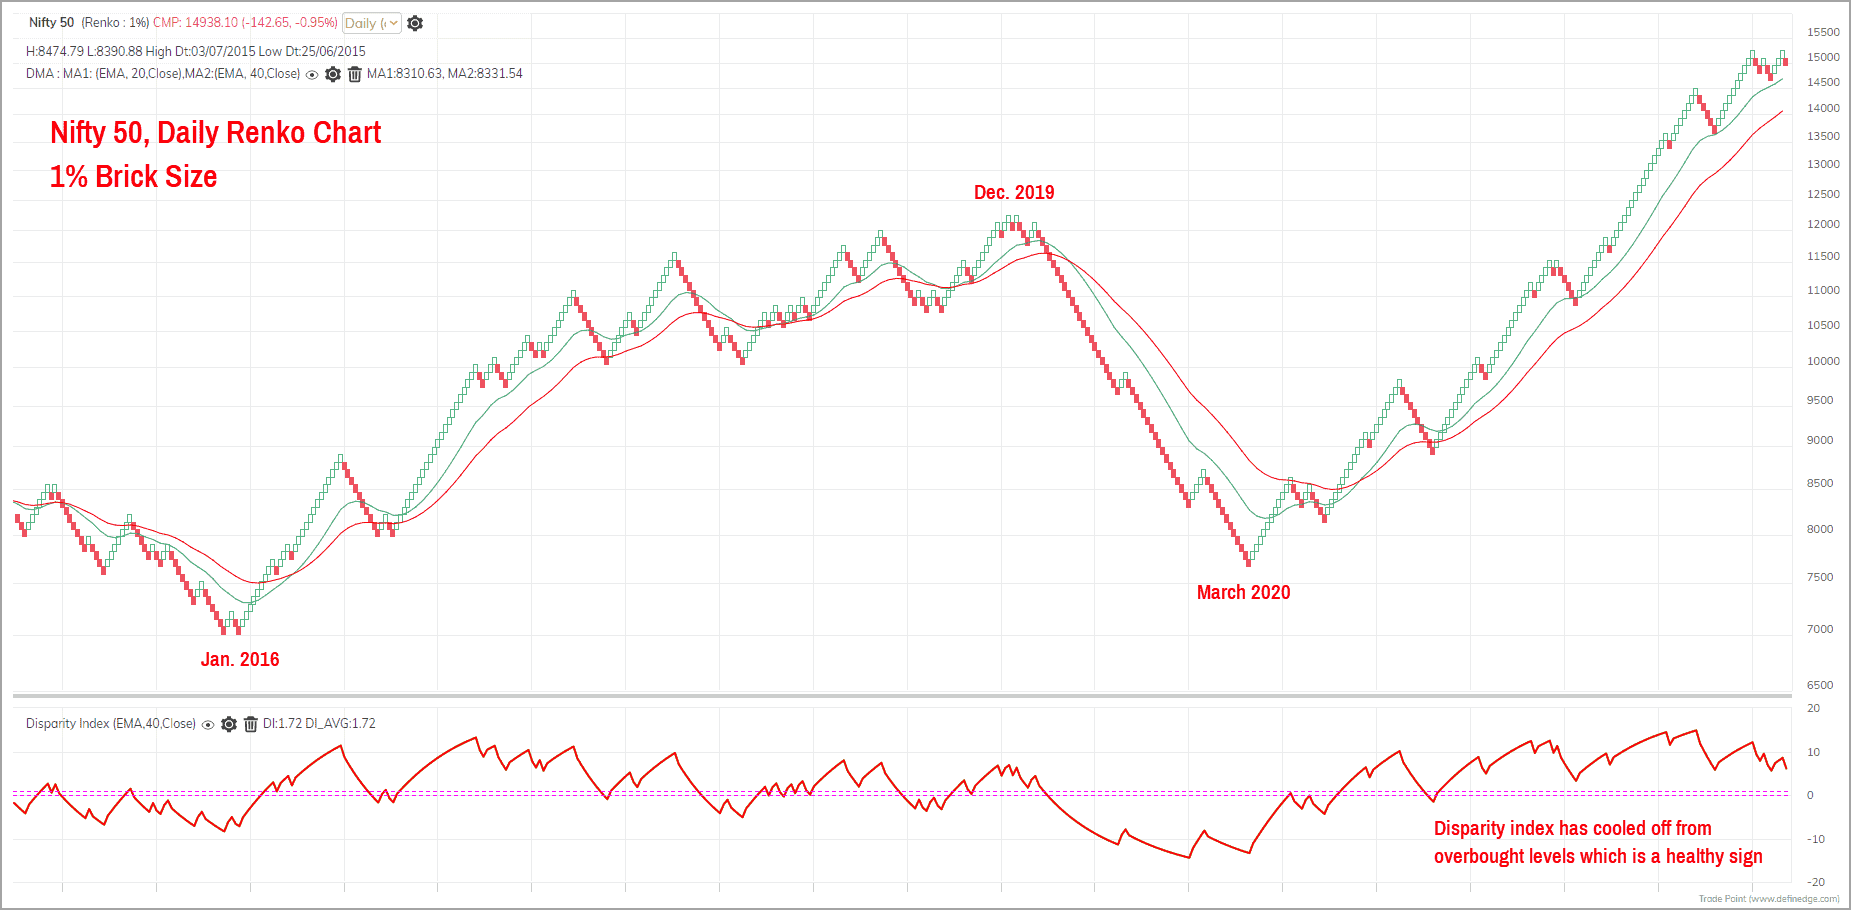
You’ll notice that the disparity index – featured in the lower pane of the chart – has already cooled off from higher levels. If you recall, we had highlighted in the previous nifty analysis (https://primeinvestor.in/2021-nifty50-outlook/) that the disparity index was at an extreme zone suggesting overbought conditions, indicating the possibility of a correction.
The correction did materialise, resulting in the disparity index moderating in this time frame. From a short-term perspective, therefore, the disparity index is no longer in the overbought zone, which is a positive sign.
Short-term Nifty target
The obvious question for most of the market participants would be: What is the next target for the Nifty 50 index? For this, let’s use the Point & Figure chart of Nifty 50 featured below.
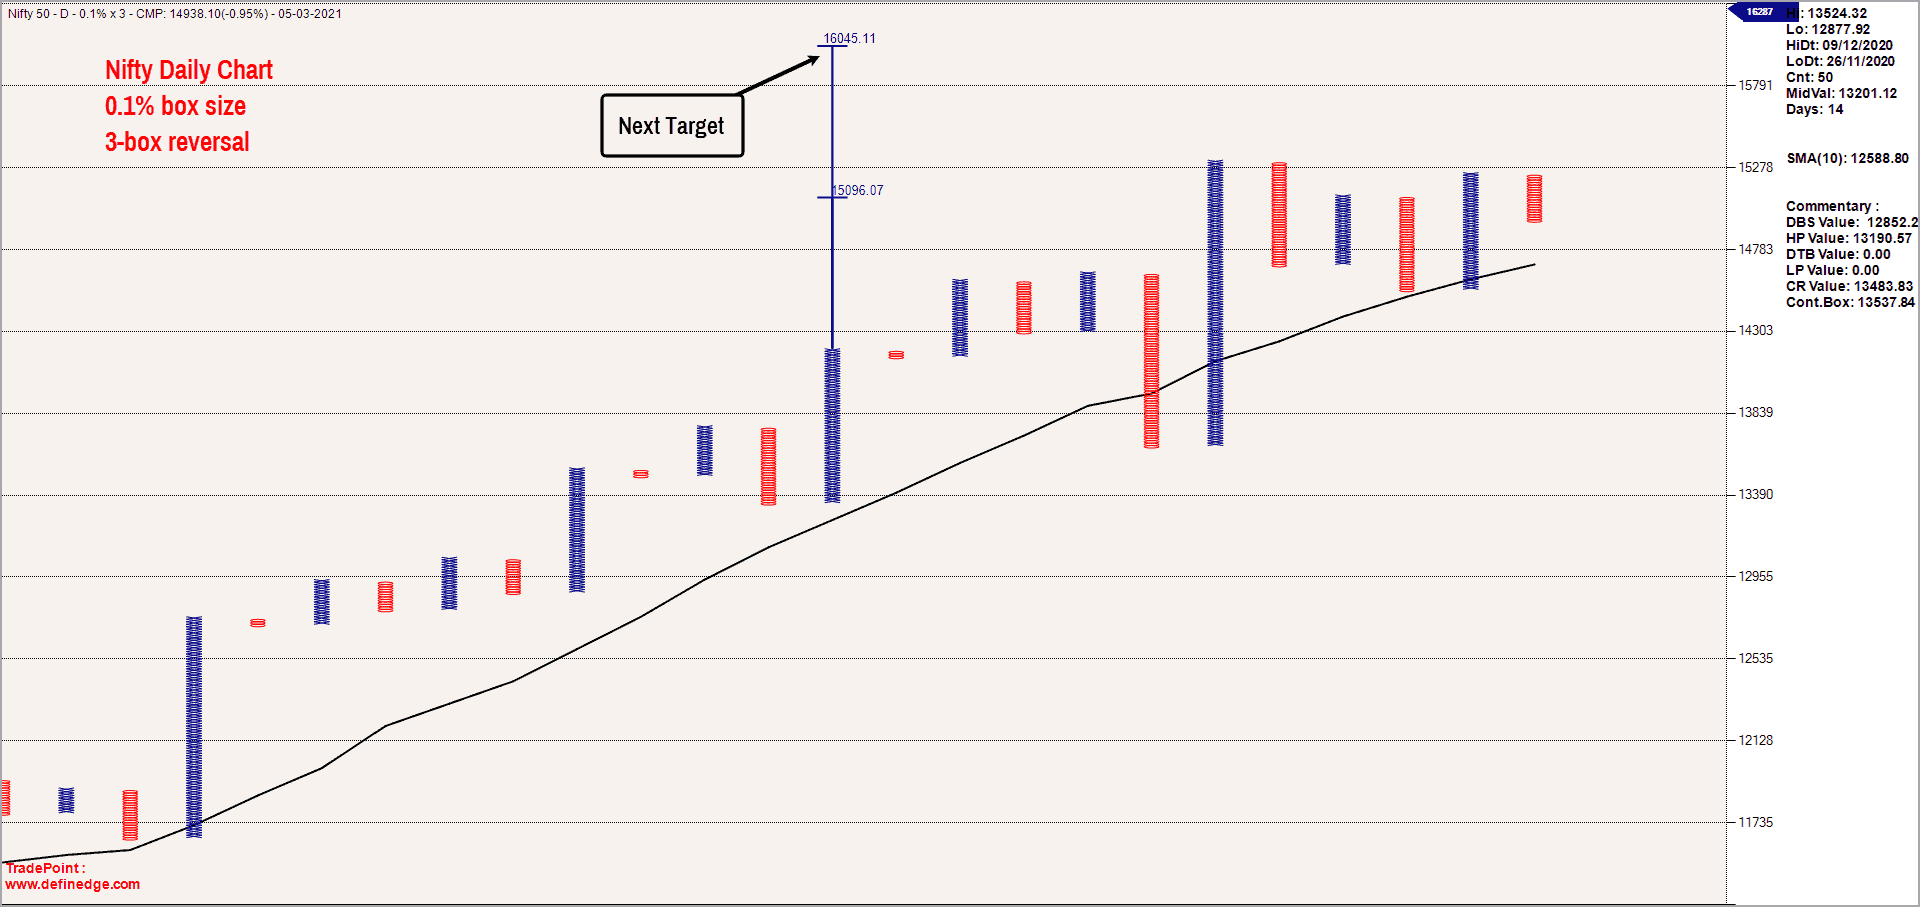
Based on the Point & Figure vertical count methodology, the upside target in the Nifty analysis works out to 16,045. This target would remain valid until 13,300 is not breached on a fall. For short-term traders and those who prefer a closer reference point, the recent swing low of 14,500 would be a level to watch out for.
A close below this level would be an early sign of weakness and could be considered as a forewarning to a deeper cut in the Nifty 50 index. A close below 13,600 would invalidate the bullish trend altogether and would result in a bearish pattern of lower highs and lower lows.
Therefore, I would remain bullish on the Nifty until 13,600 is not breached. We will come up with a follow-up post with a revised outlook and targets if and when this level is violated.
Broader market perspective
Before we wind up, here is a quick look at the broader market beyond the Nifty. The Nifty Mid-Small cap 400 index is at life time highs and there are open upside targets of 8,980 and 9,530. This broader market index is also outperforming the Nifty 50 index suggesting that there is no panic as yet in the broader market even though the Nifty analysis has witnessed some wild gyrations recently.
The only cause of concern is that that market breadth of Nifty 500 index is at overbought levels. The percentage of stocks trading above their 200-day moving average is the market breadth indicator. This indicator is now at 91.8% indicating that majority of the stocks from the Nifty 500 index are trading above their 200-day moving average.
While this is a healthy sign from the perspective of participation in stocks beyond the index, any reading beyond 75% also suggests that the market is in the overbought zone. Again, this does not warrant panic, but it pays to be cautious.
So, here’s sum-up of what we’re saying.

Base case or preferred outlook
Though the price action in Nifty 50 index has turned volatile, the broader market trend remains positive.
- The base case scenario is a rally in Nifty 50 index to 16,045 levels.
- Market breadth indicators are at healthy levels, but indicate over-bought conditions.
- The disparity index over a bigger time frame is also indicative of overbought conditions, a signal to be cautious.
- But as long as the recent swing low of 13,600 is not violated, we will remain bullish on the Nifty 50.
- Considering that the market breadth and the disparity index over a bigger time frame are at overbought levels, there is a possibility of a deeper pullback in the Nifty 50.
- But let us not second-guess the timing of this deeper pullback scenario. It would be better to watch for a fall below 14,500, which would be an early sign of such a pullback.
The question now is: How do we deal with this market which is displaying bullish signs but is in the overheated zone?
Here are a few suggestions.
- Do not aggressively increase your equity exposure at the current levels.
- Have a clearly defined exit plan for your existing equity holdings.
- Exits are underrated and the quality of your exits influence the return on investment.
- At this juncture, focus on quality names or stick to the mutual fund route.
- Do not tamper with your SIPs based on observations here.
Enjoy the party while it lasts. A process-oriented approach is always helpful while investing in stock markets. So, choose a logical process and stick to it. This removes the anxiety and the fear around what the markets will do.


16 thoughts on “Where’s the Nifty headed? A technical analysis”
Dear Mr.Krishnakumar,
My compliments for writing a simple article on NIFTY with clarity.
Reading the article more than once will be useful to every one.
Keep writing,
Bala
Hello:
Thanks a lot for the feedback. Glad that you found it useful.
Regards
B.Krishnakumar
Hello.. just curious to know on the extent of correction that can come if the nifty goes below 13600..if by looking on charts you are able to predict the major support level for nifty from where the probability of bouncing back is more.
Thanks for the information.
Hello:
It would be too premature to predict a breach of 13,600 and the extent of the fall thereafter. Let us not preempt anything. We shall discuss this scenario when the levels get violated. Until then enjoy the ride !!!
Regards
B.Krishnakumar
A great follow-up article. Nice to see your earlier observations were validated.
Your points about an exit strategy are very valid. The market keeps retracting in a couple of days after falling and that makes exiting harder. All part of the game though 🙂
I look forward to more of your articles, thanks.
Hello:
Yes, markets go through cycles and unless we have a clearly defined exit plan, it would be difficult to deal with such wild movements. The articles I write reflect my approach & thoughts on the markets. But, there is no one-size-fits-all solution. I hope the thoughts shared through my post serves as a broad guide to the readers.
Regards
B.Krishnakumar
Good call at the right time. These 2 levels of 14500 and 13600 …are they daily closing levels? intra day or weekly/monthly? pl clarify (I am an absolute novice in tech reading of charts !!)
Hello:
The levels mentioned are with respect to closing levels on a daily basis. In other words, a daily close below 14,500 would be the first warning sign. A daily close below 13,600 would indicate the onset of a probably deeper cut in the Nifty 50 index.
Regards
B.Krishnakumar
Today’s closure at 14324, broke the 14500 lakshman rekha decisively …..and based on this writer’s feedback, this was the level to watch….now – 13600 looks inevitable at some point
“A close below 13,600 would invalidate the bullish trend altogether and would result in a bearish pattern of lower highs and lower lows.
In simple english what does this mean actually?
Hello:
What I meant in that statement was that if Nifty 50 index closes below 13,600, it would mean that the trend is not longer positive. In other words, my outlook on the Nifty 50 index would turn negative below 13,600.
In technical analysis (which a study of historical price action & price patterns), uptrend is defined as a sequence of higher highs and higher lows. Similarly, a downtrend is defined as a sequence of lower highs and lower lows. If the Nifty 50 index closes below 13,600, it would complete a negative sequence of lower highs and lower lows is what I meant.
Hope this helps.
Regards
B.Krishnakumar
understood,thanks
Very good analysis.
I agree with you that retail investors should be cautious.
Sudhakarudu
Thanks a lot.
Regards
B.Krishnakumar
Simple, lucid and neatly put. You should re start writing on index again. That Sunday edition of Business Line was exclusively purchased only to read your view and Lokeshwari questions in certain stocks
Thanks
Hello Madhavan:
Appreciate your feedback. Glad you found the post useful.
Regards
B.Krishnakumar
Comments are closed.