It’s been interesting times for the Nifty 50 in the past month! As we observed in the previous update, the Nifty 50 index remained bullish and managed to reach the first target of 18,640-18,700 zone that we had set. The index appears on course to reach even the second target of 19,100 mentioned in the outlook last month.
So now, we’ll dig deeper to understand the current technical status of the Nifty 50 index and assess the possibility of slightly extended targets, if any.
Short-term outlook for the Nifty 50
We shall focus on the short-term outlook in this post. Let us get started with our usual set of charts – and here is the 0.25% Renko chart of the Nifty 50 index.
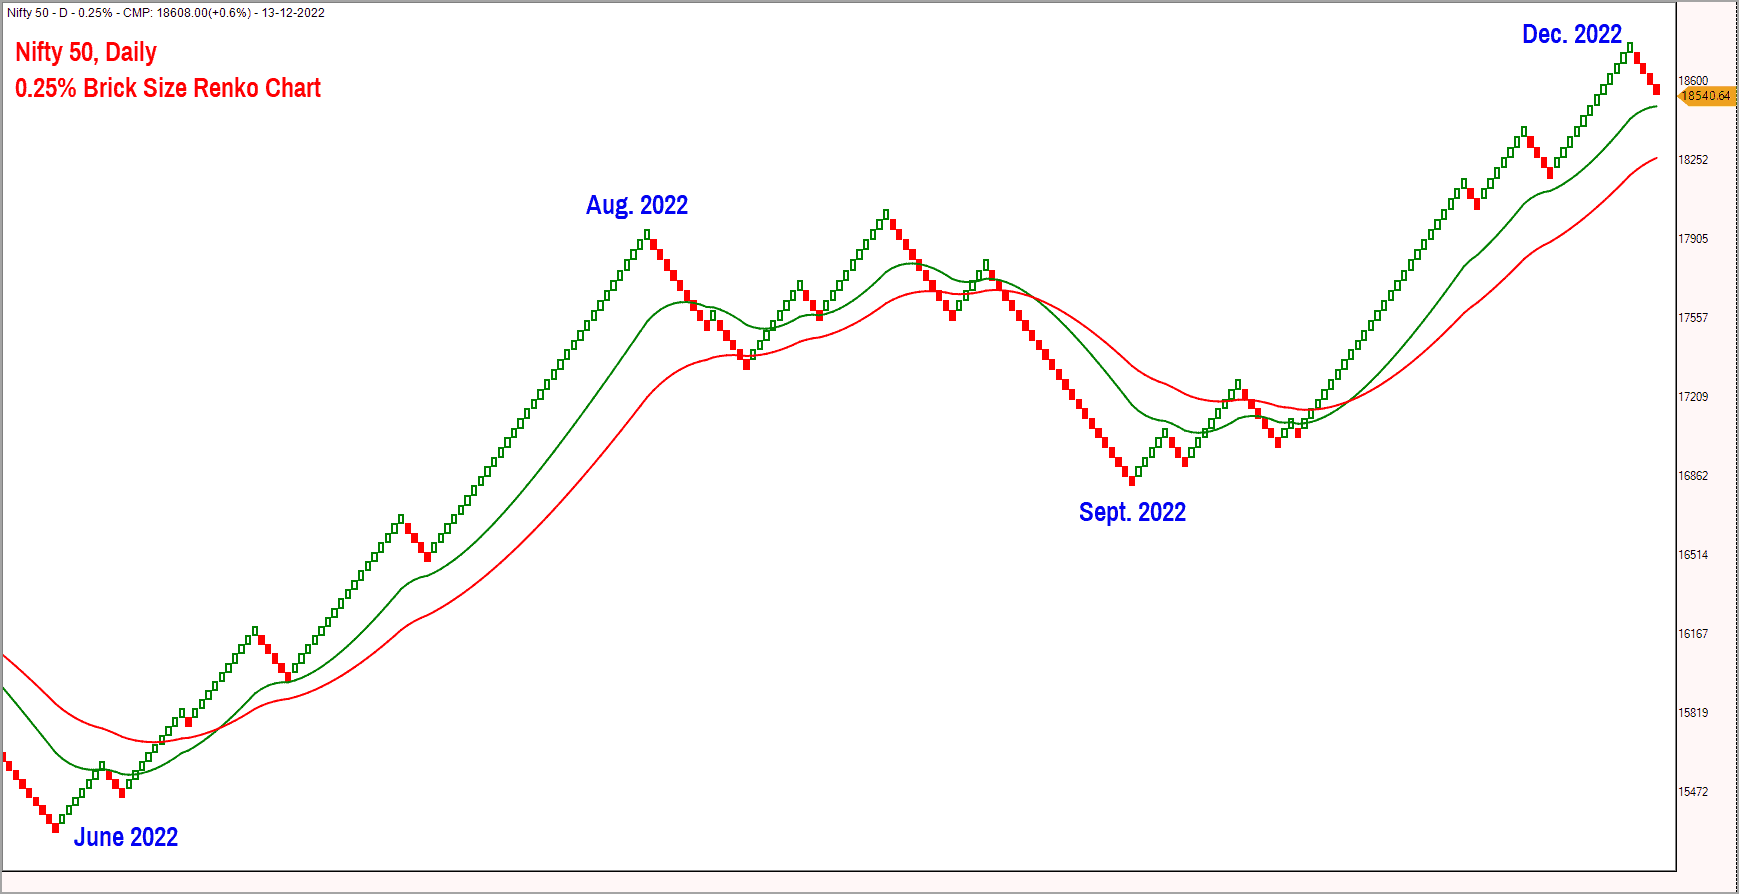
It is evident from the above chart that the index is making a bullish sequence of higher highs and higher lows. Moreover, the price is trading above the moving averages which confirms bullishness. While the immediate target for Nifty is 19,100, there is a possibility of the index heading to 19,700-20,100 zone as well. These higher targets are based on the horizontal count method of calculating targets in the Point & Figure chart.
Interestingly, the short-term breadth indicators are supportive of a rally to 19,100 as well. As always, we shall use the PF-X% indicator as a tool to assess market breadth. This indicator captures the percentage of stocks that are in a bullish swing in the Point & Figure chart.

To study the short-term breadth indicator, we use the 1% box size chart. The PF-X% in the short-term time frame has cooled off from the overbought zone and is currently positioned in the neutral territory, supporting the case for a further upside in the Nifty 50 index. The indicator is currently at 46% and placed well below the overbought reading of 75%. Price-wise too, the Nifty 50 index is not overbought – which is evident from the positioning of the price in relation to the moving averages in the above Renko chart.
In other words, both price and short-term breadth are supportive of a rally to 19,100. In the event of a euphoric move, the rally could extend to 19,700 as well. Whether or not this euphoric move will play out is too premature to predict. So before getting carried away by euphoria, let us be mindful of a few red flags too.
The first red flag is that the breadth in the bigger time is still overbought. I am talking about the PF-X% breadth indicator in the 5% box size. This is a long-term breadth indicator and there have been instances where this indicator has remained overbought for several months. But eventually price has cooled off, resulting in a corresponding cool off in this breadth indicator.
The other red flag is that, seasonally, the Nifty 50 index has tended to get into a corrective phase either in the months of January or February. The index has historically witnessed either a significant time or price correction in the first few months of the calendar year.
Given this backdrop, it will definitely not hurt to approach markets with a tinge of caution, especially once it hits the immediate target of 19,100. As I always say, have an exit plan, irrespective of whether you are a short-term or medium term or long-term investor. Until you plan to pass on your equity holdings to the next generation, I see little merit in not having a clearly defined exit plan. This exit plan should be in sync with your investment time frame.
Now let’s move to the broader markets. I’ve been reading several messages on social media about how the Nifty 50 is near all-time highs while individual portfolios are not reflective of this positiveness. So let’s try to understand what is happening to market segments outside the Nifty 50. We shall study the Nifty Small Cap 250 index for understanding the context.

Nifty Smallcap 250 index yet to catch up
Featured below is the 1% Renko chart of the Nifty Small Cap 250 index.
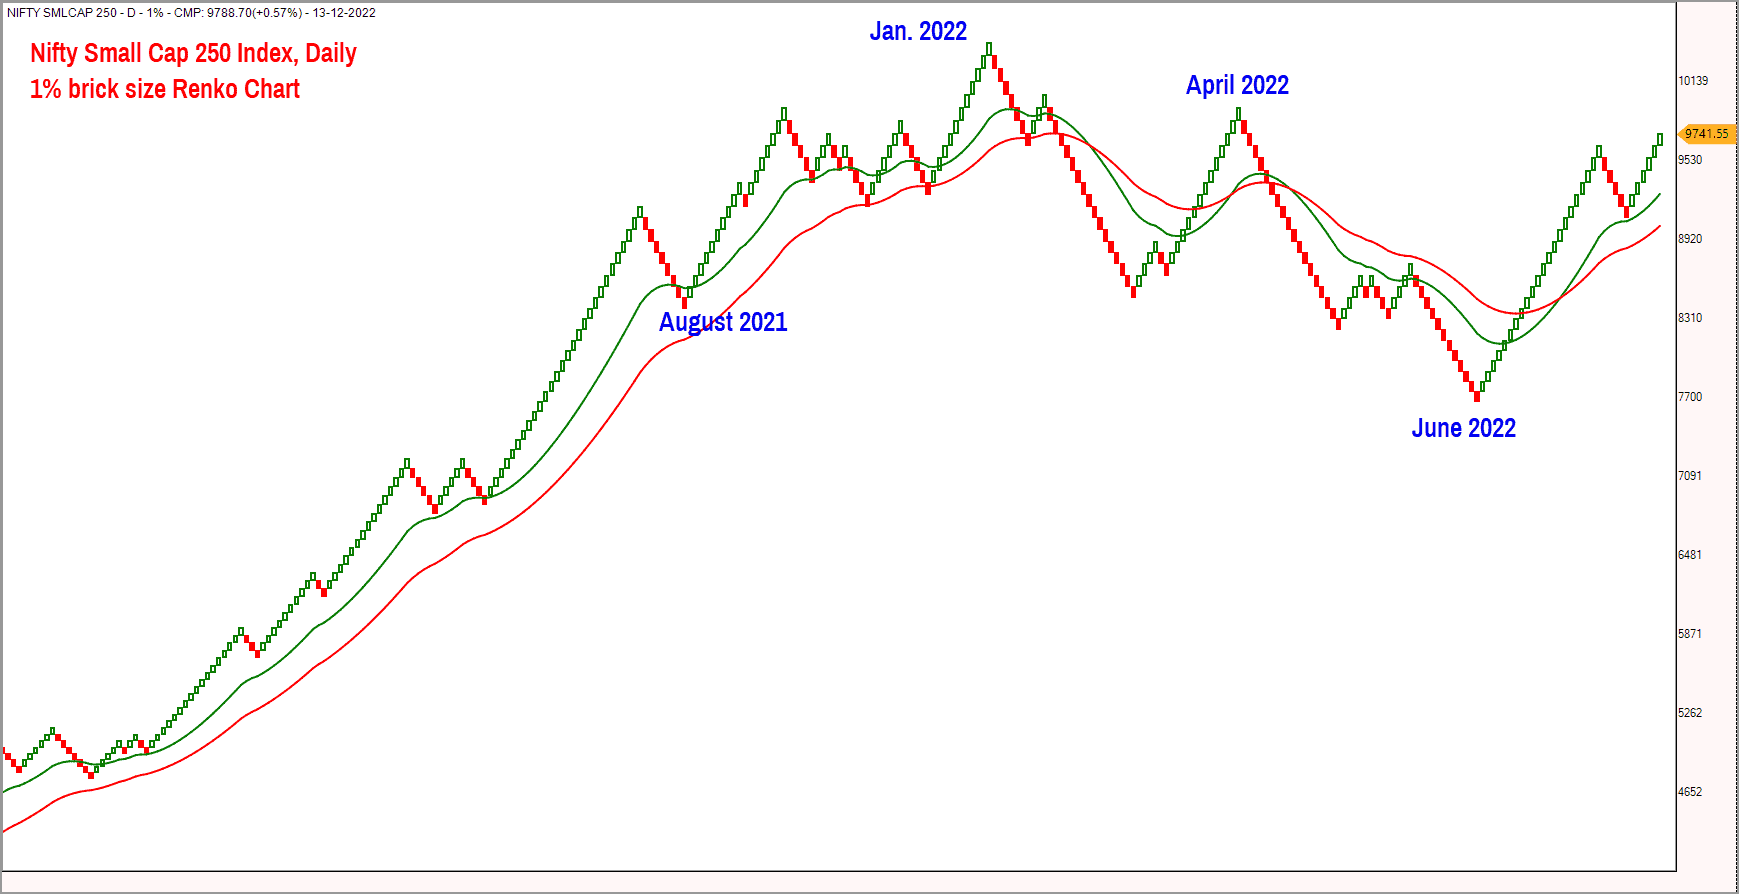
While the Nifty 50 index hit a fresh all-time high, the Nifty Small Cap 250 index is yet to do so. The index is still trading 7% below the all-time high of 10,524 recorded in January this year. A look at the ratio chart of Nifty Small Cap 250 index versus Nifty 50 index suggests that the small cap index has been underperforming the Nifty 50 index since January 2022.
Given this, it is not surprising to see individual portfolios not quite sharing the same positivity displayed by the Nifty 50 index!
The lack of participation of broader markets is definitely another red flag to be mindful of. This highlights the importance of focusing on the right sector / index in order to generate meaningful returns.
The scenario is not different even if you look at the price action and relative performance of the slightly more broad-based Nifty MidSmall Cap 400 index. There is clear sign that this index too is not outperforming the Nifty 50 index. Hence, if your portfolio is exposed to mid & small cap stocks, then you might have a muted celebration while the Nifty 50 index is marching higher.
Wait for a clear breakout in the Nifty Small Cap 250 index and, more importantly, look for evidence of relative outperformance of this index versus the Nifty 50 before increasing exposure to this space.
Have a look at the short-term breadth indicator of the Nifty 450 stocks (Nifty 500 minus Nifty 50).
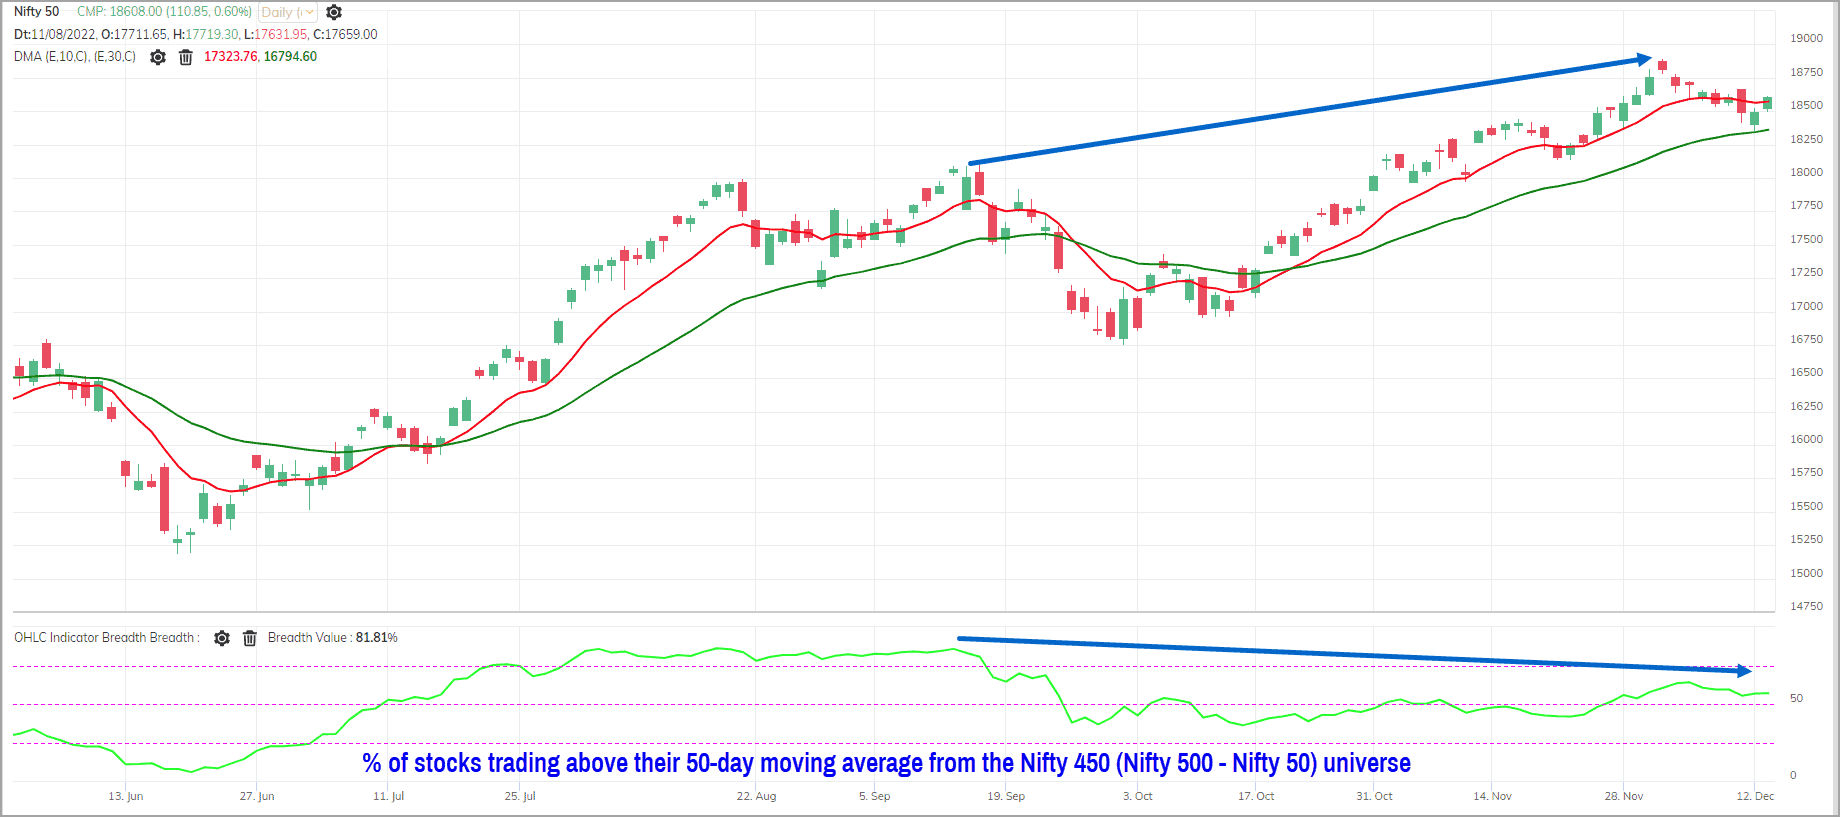
The Nifty 50 chart is featured in the top pane and the percentage of stocks trading above their 50-day moving average is featured in the bottom pane. The bottom pane captures the short-term breadth of the Nifty 450 universe.

The breadth indicator is at 57% indicating that more than 40% of the universe is still trading below the short-term moving average. This is not a healthy sign when the Nifty 50 index has hit a fresh all-time high.
To summarise, while the short-term trend remains bullish, the Nifty 50 breadth in the bigger time frame is overbought. The seasonality aspect highlighted earlier is another factor to be mindful of. The final red flag is the lack of participation of the broader markets. The message therefore is to enjoy the party until it lasts. But be mindful of not letting the enjoyment turn into an ugly hangover.


2 thoughts on “Technical outlook: Can the new Nifty 50 targets be extended?”
Hi
Which charting software you are using for Breadth ?
Regards
I appreciate the conclusion and guidance of the analysis
Comments are closed.